|
Download Data (XLS File) |
|
||||||||
|
||||||||
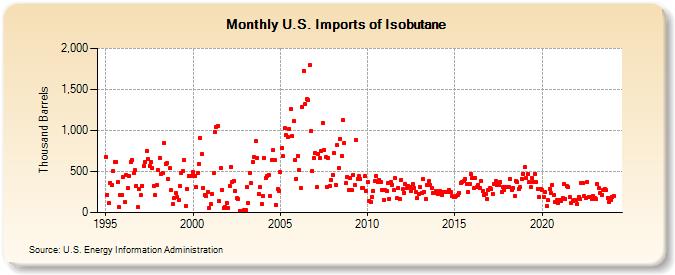
| U.S. Imports of Isobutane (Thousand Barrels) | ||||||||
| Year | Jan | Feb | Mar | Apr | May | Jun | Jul | Aug | Sep | Oct | Nov | Dec |
|---|---|---|---|---|---|---|---|---|---|---|---|---|
| 1995 | 681 | 216 | 115 | 366 | 332 | 506 | 612 | 621 | 372 | 65 | 219 | 210 |
| 1996 | 436 | 127 | 461 | 297 | 446 | 617 | 643 | 477 | 514 | 328 | 64 | 291 |
| 1997 | 213 | 329 | 565 | 614 | 756 | 652 | 570 | 616 | 545 | 327 | 213 | 334 |
| 1998 | 516 | 667 | 470 | 488 | 848 | 593 | 603 | 405 | 537 | 269 | 104 | 175 |
| 1999 | 237 | 186 | 156 | 326 | 476 | 501 | 637 | 84 | 285 | 443 | 441 | 448 |
| 2000 | 497 | 443 | 310 | 486 | 595 | 910 | 712 | 300 | 212 | 196 | 249 | 60 |
| 2001 | 100 | 227 | 478 | 977 | 1,045 | 1,058 | 138 | 541 | 279 | 61 | 69 | 122 |
| 2002 | 54 | 327 | 561 | 378 | 389 | 260 | 173 | 166 | 19 | 14 | 15 | 27 |
| 2003 | 36 | 311 | 116 | 485 | 355 | 615 | 674 | 869 | 665 | 231 | 311 | 109 |
| 2004 | 204 | 666 | 421 | 449 | 463 | 200 | 639 | 760 | 644 | 97 | 283 | 262 |
| 2005 | 489 | 781 | 683 | 1,026 | 939 | 921 | 1,020 | 1,261 | 928 | 1,116 | 639 | 414 |
| 2006 | 693 | 513 | 294 | 1,289 | 1,730 | 1,317 | 1,380 | 1,372 | 1,792 | 991 | 504 | 666 |
| 2007 | 723 | 310 | 716 | 659 | 752 | 1,097 | 761 | 671 | 315 | 668 | 326 | 398 |
| 2008 | 459 | 725 | 341 | 821 | 538 | 900 | 688 | 1,125 | 845 | 359 | 437 | 277 |
| 2009 | 421 | 276 | 456 | 335 | 883 | 414 | 440 | 412 | 298 | 294 | 441 | 258 |
| 2010 | 371 | 140 | 130 | 194 | 265 | 388 | 448 | 370 | 402 | 373 | 279 | 150 |
| 2011 | 279 | 259 | 360 | 171 | 375 | 337 | 271 | 417 | 174 | 304 | 167 | 397 |
| 2012 | 282 | 241 | 349 | 301 | 325 | 307 | 261 | 354 | 304 | 248 | 175 | 223 |
| 2013 | 317 | 236 | 403 | 256 | 167 | 330 | 381 | 339 | 303 | 240 | 240 | 263 |
| 2014 | 232 | 236 | 261 | 217 | 250 | 252 | 247 | 250 | 279 | 253 | 197 | 195 |
| 2015 | 194 | 198 | 214 | 244 | 355 | 375 | 387 | 405 | 342 | 254 | 347 | 466 |
| 2016 | 418 | 298 | 423 | 306 | 339 | 305 | 380 | 262 | 213 | 231 | 169 | 271 |
| 2017 | 301 | 283 | 228 | 345 | 386 | 337 | 336 | 373 | 253 | 312 | 275 | 306 |
| 2018 | 317 | 313 | 409 | 280 | 305 | 207 | 385 | 372 | 289 | 306 | 412 | 474 |
| 2019 | 550 | 421 | 467 | 367 | 310 | 420 | 372 | 470 | 372 | 292 | 191 | 284 |
| 2020 | 272 | 188 | 245 | 77 | 149 | 287 | 241 | 341 | 216 | 127 | 149 | 114 |
| 2021 | 153 | 141 | 176 | 347 | 167 | 318 | 309 | 186 | 117 | 142 | 147 | 155 |
| 2022 | 99 | 191 | 170 | 359 | 357 | 206 | 179 | 373 | 195 | 184 | 163 | 203 |
| 2023 | 183 | 162 | 347 | 297 | 239 | 218 | 277 | 286 | 269 | 183 | 133 | 149 |
| 2024 | 193 | |||||||||||
| - = No Data Reported; -- = Not Applicable; NA = Not Available; W = Withheld to avoid disclosure of individual company data. |
| Release Date: 3/29/2024 |
| Next Release Date: 4/30/2024 |