|
Download Data (XLS File) |
|
||||||||
|
||||||||
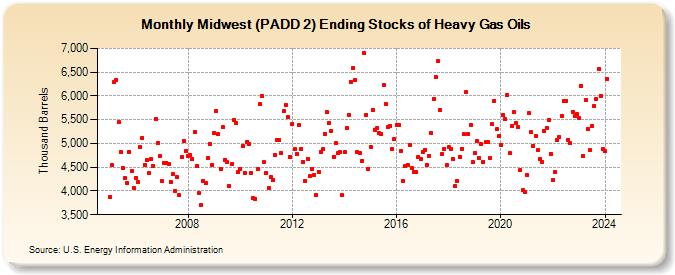
| Midwest (PADD 2) Ending Stocks of Heavy Gas Oils (Thousand Barrels) | ||||||||
| Year | Jan | Feb | Mar | Apr | May | Jun | Jul | Aug | Sep | Oct | Nov | Dec |
|---|---|---|---|---|---|---|---|---|---|---|---|---|
| 2005 | 3,876 | 4,536 | 6,286 | 6,332 | 5,444 | 4,827 | 4,478 | 4,271 | 4,170 | 4,823 | 4,430 | 4,060 |
| 2006 | 4,282 | 4,183 | 4,929 | 5,115 | 4,555 | 4,645 | 4,371 | 4,662 | 4,534 | 5,513 | 5,007 | 4,727 |
| 2007 | 4,206 | 4,590 | 4,595 | 4,570 | 4,194 | 4,366 | 4,000 | 4,300 | 3,908 | 4,711 | 5,052 | 4,842 |
| 2008 | 4,732 | 4,757 | 4,667 | 5,240 | 4,525 | 3,958 | 3,703 | 4,212 | 4,157 | 4,686 | 4,991 | 4,554 |
| 2009 | 5,215 | 5,682 | 5,193 | 4,466 | 5,339 | 4,659 | 4,609 | 4,103 | 4,565 | 5,501 | 5,429 | 4,394 |
| 2010 | 4,456 | 4,949 | 4,384 | 5,027 | 4,987 | 4,379 | 3,850 | 3,836 | 4,464 | 5,821 | 6,000 | 4,599 |
| 2011 | 4,386 | 4,054 | 4,289 | 4,229 | 4,753 | 5,076 | 5,067 | 4,794 | 5,674 | 5,811 | 5,552 | 4,721 |
| 2012 | 5,409 | 4,879 | 4,781 | 5,388 | 4,890 | 4,617 | 4,211 | 4,678 | 4,305 | 4,456 | 4,339 | 3,924 |
| 2013 | 4,402 | 4,825 | 4,874 | 5,199 | 5,656 | 5,436 | 5,264 | 4,725 | 5,003 | 4,793 | 4,813 | 3,910 |
| 2014 | 4,816 | 5,323 | 5,606 | 6,297 | 6,577 | 6,328 | 4,815 | 4,794 | 4,638 | 6,899 | 5,605 | 4,459 |
| 2015 | 4,932 | 5,712 | 5,289 | 5,318 | 5,222 | 5,194 | 6,230 | 5,838 | 5,353 | 5,375 | 4,875 | 5,095 |
| 2016 | 5,398 | 5,387 | 4,842 | 4,206 | 4,516 | 4,553 | 4,972 | 4,478 | 4,389 | 4,392 | 4,716 | 4,673 |
| 2017 | 4,816 | 4,870 | 4,554 | 4,745 | 5,218 | 5,944 | 6,390 | 6,725 | 5,699 | 4,777 | 4,892 | 4,549 |
| 2018 | 4,915 | 4,893 | 4,677 | 4,102 | 4,210 | 4,723 | 4,889 | 5,189 | 6,072 | 5,203 | 5,391 | 4,599 |
| 2019 | 4,808 | 5,057 | 4,698 | 4,993 | 4,615 | 5,024 | 5,021 | 4,698 | 5,399 | 5,895 | 5,298 | 5,146 |
| 2020 | 4,973 | 5,591 | 5,508 | 6,016 | 4,790 | 5,370 | 5,665 | 5,437 | 5,341 | 4,443 | 4,023 | 3,974 |
| 2021 | 4,336 | 5,632 | 5,234 | 4,948 | 5,159 | 4,856 | 4,668 | 4,612 | 5,258 | 5,321 | 5,489 | 4,784 |
| 2022 | 4,220 | 4,401 | 5,071 | 5,139 | 5,578 | 5,896 | 5,900 | 5,079 | 5,003 | 5,668 | 5,571 | 5,613 |
| 2023 | 5,529 | 6,218 | 4,736 | 5,904 | 5,312 | 4,853 | 5,375 | 5,790 | 5,929 | 6,559 | 5,995 | 4,876 |
| 2024 | 4,833 | |||||||||||
| - = No Data Reported; -- = Not Applicable; NA = Not Available; W = Withheld to avoid disclosure of individual company data. |
| Release Date: 3/29/2024 |
| Next Release Date: 4/30/2024 |