|
Download Data (XLS File) |
|
||||||||
|
||||||||
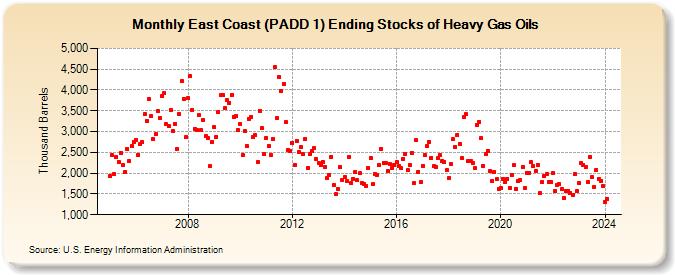
| East Coast (PADD 1) Ending Stocks of Heavy Gas Oils (Thousand Barrels) | ||||||||
| Year | Jan | Feb | Mar | Apr | May | Jun | Jul | Aug | Sep | Oct | Nov | Dec |
|---|---|---|---|---|---|---|---|---|---|---|---|---|
| 2005 | 1,938 | 2,436 | 1,983 | 2,391 | 2,267 | 2,494 | 2,184 | 2,037 | 2,582 | 2,289 | 2,647 | 2,740 |
| 2006 | 2,808 | 2,441 | 2,704 | 2,741 | 3,420 | 3,250 | 3,784 | 3,365 | 2,813 | 2,935 | 3,487 | 3,332 |
| 2007 | 3,850 | 3,922 | 3,181 | 3,136 | 3,508 | 3,020 | 3,189 | 2,570 | 3,422 | 4,204 | 3,785 | 2,861 |
| 2008 | 3,807 | 4,324 | 3,524 | 3,069 | 3,041 | 3,394 | 3,026 | 3,289 | 2,896 | 2,850 | 2,160 | 2,757 |
| 2009 | 3,102 | 2,871 | 3,468 | 3,871 | 3,888 | 3,560 | 3,748 | 3,692 | 3,881 | 3,359 | 3,375 | 3,034 |
| 2010 | 3,185 | 2,438 | 3,020 | 2,649 | 3,313 | 3,352 | 2,881 | 2,914 | 2,265 | 3,496 | 3,075 | 2,451 |
| 2011 | 2,846 | 2,662 | 2,440 | 2,832 | 4,544 | 3,315 | 4,310 | 3,976 | 4,155 | 3,220 | 2,556 | 2,524 |
| 2012 | 2,725 | 2,198 | 2,778 | 2,500 | 2,618 | 2,465 | 2,830 | 2,129 | 2,450 | 2,526 | 2,598 | 2,335 |
| 2013 | 2,252 | 2,192 | 2,279 | 2,159 | 1,875 | 1,965 | 2,394 | 1,705 | 1,491 | 1,614 | 2,152 | 1,842 |
| 2014 | 1,895 | 1,808 | 2,395 | 1,752 | 1,868 | 2,022 | 1,825 | 1,995 | 1,770 | 1,741 | 1,692 | 2,123 |
| 2015 | 2,355 | 1,727 | 1,990 | 1,966 | 2,193 | 2,588 | 2,251 | 2,249 | 2,050 | 2,212 | 2,123 | 2,196 |
| 2016 | 2,262 | 2,160 | 2,115 | 2,349 | 2,469 | 2,075 | 2,195 | 2,493 | 1,751 | 2,788 | 2,037 | 1,780 |
| 2017 | 2,180 | 2,436 | 2,641 | 2,751 | 2,372 | 2,160 | 2,145 | 2,356 | 2,431 | 2,299 | 2,270 | 2,064 |
| 2018 | 1,880 | 2,209 | 2,812 | 2,631 | 2,911 | 2,705 | 2,367 | 3,358 | 3,422 | 2,291 | 2,299 | 2,241 |
| 2019 | 2,114 | 3,167 | 3,236 | 2,834 | 2,170 | 2,461 | 2,544 | 2,056 | 1,817 | 2,029 | 1,847 | 1,619 |
| 2020 | 1,638 | 1,870 | 1,776 | 1,864 | 1,649 | 1,966 | 2,184 | 1,628 | 1,809 | 1,828 | 2,151 | 1,643 |
| 2021 | 2,014 | 2,004 | 2,258 | 2,176 | 2,054 | 2,196 | 1,514 | 1,777 | 1,935 | 1,973 | 1,792 | 1,790 |
| 2022 | 2,001 | 1,559 | 1,723 | 1,736 | 1,617 | 1,405 | 1,578 | 1,579 | 1,521 | 1,466 | 1,969 | 1,568 |
| 2023 | 1,767 | 2,242 | 2,191 | 2,139 | 1,792 | 2,399 | 1,910 | 1,676 | 2,083 | 1,863 | 1,811 | 1,687 |
| 2024 | 1,315 | |||||||||||
| - = No Data Reported; -- = Not Applicable; NA = Not Available; W = Withheld to avoid disclosure of individual company data. |
| Release Date: 3/29/2024 |
| Next Release Date: 4/30/2024 |