|
Download Data (XLS File) |
|
||||||||
|
||||||||
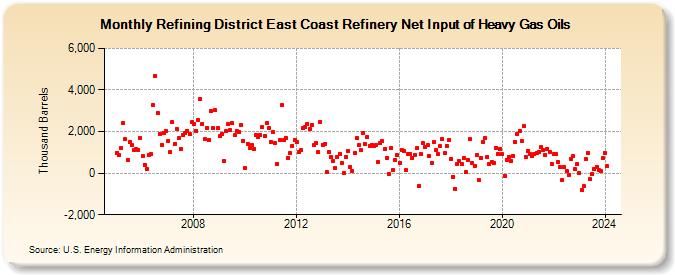
| Refining District East Coast Refinery Net Input of Heavy Gas Oils (Thousand Barrels) | ||||||||
| Year | Jan | Feb | Mar | Apr | May | Jun | Jul | Aug | Sep | Oct | Nov | Dec |
|---|---|---|---|---|---|---|---|---|---|---|---|---|
| 2005 | 991 | 869 | 1,197 | 2,414 | 1,641 | 641 | 1,508 | 1,343 | 1,112 | 1,137 | 1,115 | 1,684 |
| 2006 | 811 | 406 | 189 | 879 | 909 | 3,280 | 4,694 | 2,902 | 1,899 | 1,368 | 1,907 | 2,021 |
| 2007 | 1,554 | 1,033 | 2,468 | 1,391 | 2,140 | 1,675 | 1,183 | 1,836 | 1,910 | 2,027 | 1,861 | 2,437 |
| 2008 | 2,341 | 2,036 | 2,566 | 3,564 | 2,386 | 1,640 | 2,185 | 1,582 | 2,974 | 2,153 | 3,014 | 2,178 |
| 2009 | 1,774 | 1,879 | 599 | 2,011 | 2,354 | 2,071 | 2,392 | 1,813 | 2,022 | 1,991 | 2,298 | 1,556 |
| 2010 | 226 | 1,424 | 1,214 | 1,344 | 1,160 | 1,841 | 1,723 | 1,819 | 2,195 | 1,780 | 2,392 | 2,150 |
| 2011 | 1,502 | 1,990 | 1,472 | 450 | 1,592 | 3,257 | 1,598 | 1,705 | 728 | 956 | 1,300 | 1,589 |
| 2012 | 1,509 | 1,037 | 1,096 | 2,178 | 2,203 | 2,379 | 2,118 | 2,327 | 1,337 | 1,437 | 995 | 2,463 |
| 2013 | 1,370 | 1,404 | 66 | 1,011 | 761 | 585 | 259 | 779 | 927 | 480 | 22 | 779 |
| 2014 | 1,045 | 287 | 89 | 966 | 1,690 | 1,352 | 1,118 | 1,916 | 1,385 | 1,745 | 1,311 | 1,370 |
| 2015 | 1,314 | 1,354 | 530 | 1,444 | 1,524 | 1,163 | 733 | -32 | 1,223 | 147 | 630 | 856 |
| 2016 | 494 | 1,121 | 1,082 | 131 | 943 | 929 | 746 | 866 | 1,185 | -625 | 908 | 1,444 |
| 2017 | 1,266 | 1,349 | 818 | 480 | 1,505 | 1,110 | 908 | 1,300 | 1,656 | 952 | 1,328 | 1,602 |
| 2018 | 677 | -171 | -746 | 462 | 562 | 458 | 721 | 44 | 647 | 1,634 | 465 | 346 |
| 2019 | 873 | -347 | 723 | 1,498 | 1,680 | 781 | 433 | 544 | 504 | 1,225 | 922 | 1,167 |
| 2020 | 919 | -115 | 644 | 789 | 591 | 832 | 1,516 | 1,859 | 2,025 | 1,537 | 2,250 | 799 |
| 2021 | 1,065 | 907 | 802 | 897 | 986 | 1,026 | 1,252 | 1,095 | 886 | 1,184 | 1,019 | 461 |
| 2022 | 909 | 943 | 547 | 288 | -334 | 283 | 87 | -90 | 681 | 804 | 186 | 449 |
| 2023 | 21 | -822 | -623 | 675 | 987 | -303 | -45 | 182 | 316 | 129 | 89 | 714 |
| 2024 | 946 | 330 | ||||||||||
| - = No Data Reported; -- = Not Applicable; NA = Not Available; W = Withheld to avoid disclosure of individual company data. |
| Release Date: 4/30/2024 |
| Next Release Date: 5/31/2024 |