|
Download Data (XLS File) |
|
||||||||
|
||||||||
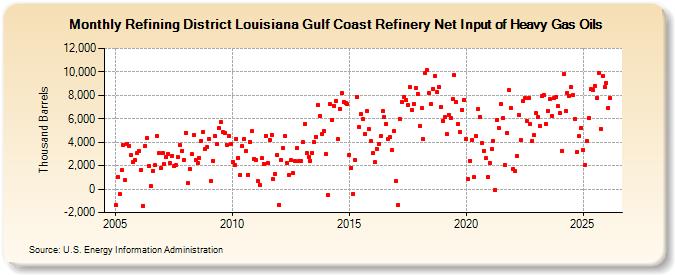
| Refining District Louisiana Gulf Coast Refinery Net Input of Heavy Gas Oils (Thousand Barrels) | ||||||||
| Year | Jan | Feb | Mar | Apr | May | Jun | Jul | Aug | Sep | Oct | Nov | Dec |
|---|---|---|---|---|---|---|---|---|---|---|---|---|
| 2005 | -1,368 | 1,033 | -448 | 1,647 | 3,777 | 738 | 3,850 | 3,715 | 2,885 | 2,291 | 2,470 | 3,044 |
| 2006 | 3,252 | 1,657 | -1,406 | 3,717 | 4,349 | 1,978 | 263 | 1,533 | 2,027 | 4,571 | 3,044 | 1,789 |
| 2007 | 3,121 | 2,106 | 2,703 | 2,994 | 2,196 | 2,855 | 1,955 | 2,080 | 2,706 | 3,762 | 3,286 | 2,509 |
| 2008 | 4,809 | 495 | 1,727 | 2,956 | 4,624 | 2,478 | 2,194 | 2,660 | 4,137 | 4,903 | 3,458 | 3,586 |
| 2009 | 4,258 | 681 | 2,427 | 4,519 | 3,807 | 5,171 | 5,707 | 4,858 | 4,801 | 3,797 | 4,525 | 3,816 |
| 2010 | 2,312 | 2,036 | 4,289 | 2,688 | 1,235 | 3,666 | 4,258 | 3,232 | 1,234 | 4,054 | 4,916 | 2,604 |
| 2011 | 2,461 | 668 | 371 | 2,625 | 2,145 | 4,557 | 2,225 | 4,167 | 4,646 | 831 | 1,281 | 2,909 |
| 2012 | -1,354 | 2,503 | 3,513 | 4,522 | 2,240 | 1,233 | 2,465 | 1,391 | 2,375 | 3,468 | 2,356 | 2,417 |
| 2013 | 4,008 | 5,545 | 3,068 | 2,714 | 2,436 | 3,097 | 3,977 | 4,465 | 7,155 | 6,215 | 4,719 | 4,955 |
| 2014 | 2,992 | -527 | 7,246 | 5,931 | 7,119 | 7,491 | 4,243 | 6,869 | 8,178 | 7,448 | 7,337 | 7,270 |
| 2015 | 2,902 | 1,812 | -384 | 2,479 | 7,868 | 5,256 | 6,382 | 5,961 | 4,696 | 6,652 | 5,091 | 4,068 |
| 2016 | 3,044 | 2,275 | 3,448 | 3,809 | 4,492 | 6,639 | 6,129 | 5,574 | 4,315 | 4,421 | 3,301 | 4,959 |
| 2017 | 658 | -1,358 | 5,944 | 7,430 | 7,890 | 7,639 | 7,169 | 8,677 | 6,777 | 7,275 | 8,661 | 8,138 |
| 2018 | 5,401 | 6,889 | 4,258 | 9,873 | 10,126 | 8,206 | 7,281 | 8,574 | 9,661 | 8,263 | 8,711 | 7,043 |
| 2019 | 5,833 | 6,118 | 4,689 | 6,351 | 6,065 | 7,685 | 9,727 | 7,407 | 5,587 | 4,889 | 6,777 | 7,637 |
| 2020 | 4,295 | 820 | 2,430 | 4,148 | 1,002 | 4,518 | 6,814 | 6,153 | 3,932 | 3,273 | 2,630 | 1,005 |
| 2021 | 2,228 | 3,406 | 4,116 | -56 | 5,934 | 5,205 | 7,261 | 6,097 | 2,033 | 4,819 | 8,424 | 6,914 |
| 2022 | 1,706 | 1,522 | 2,818 | 6,326 | 4,180 | 7,479 | 7,737 | 5,792 | 7,767 | 5,528 | 4,097 | 4,590 |
| 2023 | 6,467 | 6,161 | 5,400 | 7,949 | 7,995 | 5,589 | 6,692 | 7,645 | 6,240 | 7,730 | 7,847 | 7,090 |
| 2024 | 6,182 | |||||||||||
| - = No Data Reported; -- = Not Applicable; NA = Not Available; W = Withheld to avoid disclosure of individual company data. |
| Release Date: 3/29/2024 |
| Next Release Date: 4/30/2024 |