|
Download Data (XLS File) |
|
||||||||
|
||||||||
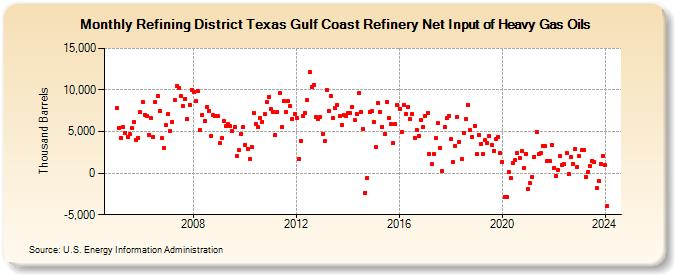
| Refining District Texas Gulf Coast Refinery Net Input of Heavy Gas Oils (Thousand Barrels) | ||||||||
| Year | Jan | Feb | Mar | Apr | May | Jun | Jul | Aug | Sep | Oct | Nov | Dec |
|---|---|---|---|---|---|---|---|---|---|---|---|---|
| 2005 | 7,851 | 5,485 | 4,236 | 5,489 | 4,859 | 4,339 | 4,648 | 5,401 | 6,147 | 4,042 | 4,239 | 7,316 |
| 2006 | 8,572 | 7,044 | 6,911 | 4,592 | 6,589 | 4,375 | 8,581 | 9,271 | 7,469 | 4,165 | 2,978 | 5,757 |
| 2007 | 7,122 | 5,040 | 6,183 | 8,801 | 10,505 | 10,234 | 9,237 | 8,084 | 8,959 | 6,527 | 8,229 | 10,028 |
| 2008 | 9,745 | 8,655 | 9,821 | 5,171 | 6,992 | 6,326 | 7,996 | 7,516 | 4,436 | 6,954 | 6,887 | 6,873 |
| 2009 | 3,584 | 4,241 | 6,291 | 5,655 | 5,947 | 5,647 | 5,010 | 5,594 | 2,088 | 2,760 | 4,702 | 5,492 |
| 2010 | 3,359 | 2,934 | 1,683 | 3,166 | 7,270 | 5,901 | 5,530 | 6,594 | 6,204 | 7,117 | 8,502 | 9,214 |
| 2011 | 7,698 | 7,367 | 4,585 | 7,365 | 9,660 | 5,571 | 8,664 | 7,403 | 8,647 | 8,026 | 6,517 | 7,107 |
| 2012 | 6,595 | 1,712 | 3,914 | 6,924 | 7,242 | 8,777 | 12,129 | 10,346 | 10,635 | 6,726 | 6,456 | 6,725 |
| 2013 | 4,754 | 3,808 | 10,000 | 7,517 | 9,326 | 6,617 | 7,884 | 8,179 | 6,865 | 5,802 | 6,941 | 6,901 |
| 2014 | 7,263 | 7,205 | 7,962 | 6,420 | 7,165 | 9,624 | 7,381 | 5,274 | -2,348 | -545 | 7,318 | 7,460 |
| 2015 | 6,175 | 3,087 | 8,473 | 7,409 | 5,580 | 4,662 | 8,527 | 6,598 | 5,933 | 3,590 | 5,927 | 8,155 |
| 2016 | 7,694 | 4,957 | 8,165 | 7,156 | 7,941 | 6,558 | 7,074 | 4,277 | 5,217 | 4,499 | 6,391 | 5,582 |
| 2017 | 6,844 | 7,220 | 2,285 | 1,057 | 2,277 | 4,207 | 6,004 | 3,047 | 247 | 5,490 | 6,575 | 6,923 |
| 2018 | 4,096 | 1,303 | 3,266 | 6,753 | 3,789 | 1,703 | 4,862 | 6,494 | 8,242 | 5,145 | 4,373 | 5,643 |
| 2019 | 2,313 | 4,541 | 3,539 | 2,311 | 3,949 | 3,654 | 4,472 | 3,390 | 2,677 | 4,089 | 4,333 | 2,363 |
| 2020 | 1,354 | -2,893 | -2,879 | 156 | -636 | 1,211 | 1,572 | 2,367 | 1,832 | 2,659 | 570 | 2,334 |
| 2021 | -1,953 | -1,230 | -524 | 1,989 | 5,001 | 2,279 | 2,381 | 3,303 | 3,254 | 1,513 | 1,471 | 3,404 |
| 2022 | 610 | -322 | 406 | 2,021 | 953 | 1,060 | 2,401 | -139 | 1,958 | 1,129 | 2,883 | 752 |
| 2023 | 2,086 | 2,772 | 2,773 | -434 | 189 | 896 | 1,516 | 1,313 | -1,787 | -969 | 1,124 | 2,112 |
| 2024 | 926 | |||||||||||
| - = No Data Reported; -- = Not Applicable; NA = Not Available; W = Withheld to avoid disclosure of individual company data. |
| Release Date: 3/29/2024 |
| Next Release Date: 4/30/2024 |