|
Download Data (XLS File) |
|
||||||||
|
||||||||
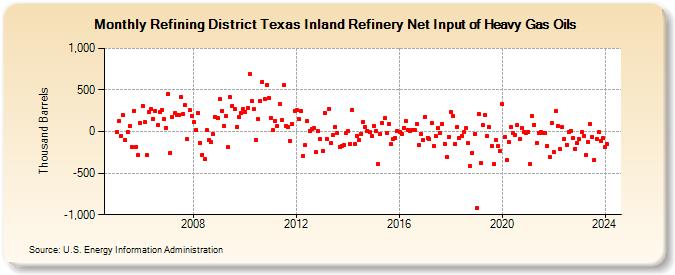
| Refining District Texas Inland Refinery Net Input of Heavy Gas Oils (Thousand Barrels) | ||||||||
| Year | Jan | Feb | Mar | Apr | May | Jun | Jul | Aug | Sep | Oct | Nov | Dec |
|---|---|---|---|---|---|---|---|---|---|---|---|---|
| 2005 | -5 | 125 | -48 | 197 | -96 | -8 | 71 | -184 | 248 | -184 | -283 | 101 |
| 2006 | 309 | 111 | -282 | 238 | 270 | 153 | 249 | 75 | 233 | 260 | 146 | 46 |
| 2007 | 456 | -252 | 172 | 218 | 205 | 200 | 411 | 212 | 315 | -95 | 258 | 189 |
| 2008 | 112 | 24 | 228 | -133 | -276 | -331 | 14 | -99 | -131 | -33 | 175 | 160 |
| 2009 | 390 | 251 | 72 | 185 | -189 | 412 | 309 | 269 | 58 | 176 | 219 | 274 |
| 2010 | 241 | 283 | 692 | 365 | 268 | -98 | 146 | 368 | 600 | 390 | 564 | 405 |
| 2011 | 161 | 17 | 132 | 70 | 330 | 138 | 555 | 72 | 49 | -114 | 91 | 252 |
| 2012 | 254 | 146 | 247 | -295 | -167 | 129 | 5 | 36 | 38 | -249 | 3 | -91 |
| 2013 | -236 | 228 | -92 | 274 | -143 | -41 | 60 | -19 | -180 | -171 | -164 | -21 |
| 2014 | 1 | -152 | 264 | -149 | -51 | -102 | -27 | 118 | 57 | 9 | -5 | -50 |
| 2015 | 72 | 4 | -395 | -30 | 103 | 157 | -16 | 90 | -151 | -94 | -74 | 4 |
| 2016 | -6 | -29 | 44 | 124 | 22 | 1 | 22 | 20 | 89 | -160 | -26 | -96 |
| 2017 | 175 | -74 | -92 | 100 | -169 | -52 | 38 | -18 | 89 | -144 | -311 | -61 |
| 2018 | 236 | 191 | -145 | 60 | -72 | -57 | -10 | 42 | -137 | -417 | -254 | -28 |
| 2019 | -923 | 209 | -382 | 77 | 201 | -55 | 49 | -168 | -391 | -96 | -173 | -234 |
| 2020 | 326 | -60 | -346 | -120 | 50 | -20 | -44 | 75 | -94 | 47 | -9 | -16 |
| 2021 | 0 | -388 | 182 | 79 | -139 | -17 | -1 | -22 | -17 | -171 | -311 | 98 |
| 2022 | -244 | 243 | 70 | -212 | 50 | -87 | -156 | -8 | 11 | -83 | -205 | -132 |
| 2023 | -94 | -9 | -55 | -281 | -120 | 88 | -66 | -339 | -84 | -10 | -114 | -83 |
| 2024 | -188 | |||||||||||
| - = No Data Reported; -- = Not Applicable; NA = Not Available; W = Withheld to avoid disclosure of individual company data. |
| Release Date: 3/29/2024 |
| Next Release Date: 4/30/2024 |