|
Download Data (XLS File) |
|
||||||||
|
||||||||
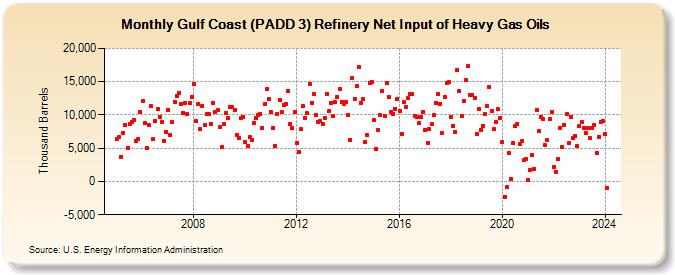
| Gulf Coast (PADD 3) Refinery Net Input of Heavy Gas Oils (Thousand Barrels) | ||||||||
| Year | Jan | Feb | Mar | Apr | May | Jun | Jul | Aug | Sep | Oct | Nov | Dec |
|---|---|---|---|---|---|---|---|---|---|---|---|---|
| 2005 | 6,410 | 6,631 | 3,716 | 7,264 | 8,538 | 5,098 | 8,589 | 8,894 | 9,299 | 6,052 | 6,308 | 10,508 |
| 2006 | 12,082 | 8,743 | 5,088 | 8,477 | 11,279 | 6,422 | 9,053 | 10,837 | 9,739 | 8,926 | 6,094 | 7,438 |
| 2007 | 10,757 | 6,937 | 8,880 | 11,953 | 12,905 | 13,325 | 11,585 | 10,258 | 11,861 | 10,124 | 11,783 | 12,746 |
| 2008 | 14,631 | 9,044 | 11,664 | 7,881 | 11,354 | 8,491 | 10,193 | 10,068 | 8,606 | 11,798 | 10,394 | 10,689 |
| 2009 | 8,115 | 5,150 | 8,701 | 10,339 | 9,590 | 11,206 | 11,135 | 10,789 | 7,021 | 6,576 | 9,553 | 9,704 |
| 2010 | 5,945 | 5,299 | 6,625 | 6,298 | 8,817 | 9,499 | 9,938 | 10,171 | 8,067 | 11,599 | 13,910 | 12,362 |
| 2011 | 10,415 | 8,033 | 5,298 | 10,196 | 12,249 | 10,465 | 11,542 | 11,612 | 13,571 | 8,653 | 7,983 | 10,411 |
| 2012 | 5,823 | 4,484 | 7,827 | 11,272 | 9,565 | 10,240 | 14,690 | 11,795 | 13,160 | 9,993 | 8,955 | 9,029 |
| 2013 | 8,675 | 9,580 | 13,208 | 10,557 | 11,782 | 9,801 | 11,962 | 12,740 | 13,913 | 11,938 | 11,614 | 11,962 |
| 2014 | 10,052 | 6,202 | 15,492 | 12,436 | 14,333 | 17,188 | 11,779 | 12,374 | 5,969 | 6,984 | 14,796 | 14,914 |
| 2015 | 9,217 | 4,873 | 7,781 | 9,941 | 13,598 | 9,878 | 14,817 | 12,691 | 10,471 | 10,169 | 10,942 | 12,399 |
| 2016 | 10,652 | 7,184 | 11,882 | 11,199 | 12,489 | 13,122 | 13,208 | 9,847 | 9,683 | 8,727 | 9,690 | 10,484 |
| 2017 | 7,741 | 5,792 | 7,915 | 8,567 | 9,982 | 11,839 | 13,209 | 11,621 | 7,239 | 12,623 | 14,852 | 14,936 |
| 2018 | 9,664 | 8,353 | 7,386 | 16,705 | 13,536 | 9,897 | 12,077 | 15,187 | 17,380 | 12,926 | 12,989 | 12,534 |
| 2019 | 7,171 | 10,834 | 7,743 | 8,394 | 10,114 | 11,308 | 14,139 | 10,536 | 7,828 | 8,903 | 10,891 | 9,605 |
| 2020 | 5,936 | -2,288 | -867 | 4,225 | 403 | 5,717 | 8,333 | 8,633 | 5,660 | 6,030 | 3,257 | 3,305 |
| 2021 | 186 | 1,735 | 3,938 | 1,933 | 10,757 | 7,523 | 9,688 | 9,352 | 5,413 | 6,188 | 9,342 | 10,476 |
| 2022 | 2,162 | 1,435 | 3,344 | 8,086 | 5,215 | 8,479 | 10,081 | 5,728 | 9,709 | 6,577 | 6,814 | 5,262 |
| 2023 | 8,319 | 8,919 | 8,096 | 7,256 | 8,054 | 6,525 | 8,090 | 8,502 | 4,327 | 6,747 | 8,952 | 9,117 |
| 2024 | 7,067 | |||||||||||
| - = No Data Reported; -- = Not Applicable; NA = Not Available; W = Withheld to avoid disclosure of individual company data. |
| Release Date: 3/29/2024 |
| Next Release Date: 4/30/2024 |