|
Download Data (XLS File) |
|
||||||||
|
||||||||
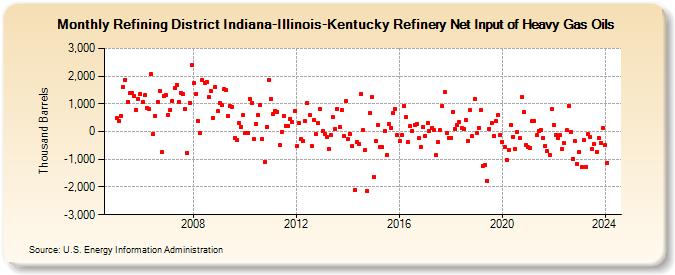
| Refining District Indiana-Illinois-Kentucky Refinery Net Input of Heavy Gas Oils (Thousand Barrels) | ||||||||
| Year | Jan | Feb | Mar | Apr | May | Jun | Jul | Aug | Sep | Oct | Nov | Dec |
|---|---|---|---|---|---|---|---|---|---|---|---|---|
| 2005 | 484 | 378 | 570 | 1,625 | 1,867 | 1,077 | 1,379 | 1,391 | 1,275 | 795 | 1,177 | 1,369 |
| 2006 | 1,075 | 1,311 | 851 | 803 | 2,070 | -81 | 556 | 1,064 | 1,468 | -742 | 1,276 | 1,314 |
| 2007 | 605 | 786 | 1,115 | 1,569 | 1,689 | 1,083 | 1,392 | 1,353 | 813 | -766 | 1,039 | 2,401 |
| 2008 | 1,742 | 1,370 | 375 | -66 | 1,863 | 1,751 | 1,788 | 1,236 | 1,466 | 490 | 1,614 | 725 |
| 2009 | 1,038 | 945 | 1,523 | 1,492 | 553 | 908 | 891 | -232 | -319 | 311 | 169 | 590 |
| 2010 | -40 | -39 | 1,170 | 1,014 | -265 | 287 | 589 | 958 | -263 | -1,092 | 175 | 1,849 |
| 2011 | 1,176 | 626 | 759 | 719 | -495 | -7 | 572 | 192 | 203 | 436 | 341 | 740 |
| 2012 | -536 | 310 | -274 | -348 | 369 | 1,016 | 591 | -517 | 420 | -101 | 302 | 820 |
| 2013 | 27 | -98 | -191 | -639 | -131 | 507 | 100 | 828 | 149 | 779 | -156 | 1,095 |
| 2014 | -281 | -81 | -527 | -2,116 | -360 | -440 | 1,357 | 54 | -670 | -2,148 | 673 | 1,251 |
| 2015 | -1,627 | -342 | 236 | -570 | -566 | 5 | -862 | 266 | 144 | 653 | 830 | -141 |
| 2016 | -348 | -125 | 937 | 523 | -388 | 193 | 28 | 238 | 269 | -249 | -547 | 175 |
| 2017 | -146 | 320 | 24 | 126 | 63 | -858 | -378 | 41 | 916 | 1,411 | -35 | -219 |
| 2018 | -223 | 720 | 91 | 221 | 350 | 125 | 84 | 424 | -338 | 765 | -174 | 1,176 |
| 2019 | -39 | 133 | 775 | -1,234 | -1,200 | -1,768 | 102 | 307 | -165 | 372 | 583 | -127 |
| 2020 | -366 | -549 | -1,023 | -648 | 230 | -180 | -624 | -4 | -239 | 1,251 | 706 | -482 |
| 2021 | -575 | -581 | 392 | 389 | -139 | 33 | 63 | -228 | -512 | -719 | -834 | 807 |
| 2022 | 244 | -123 | -223 | -140 | -628 | -412 | 40 | 923 | -1 | -976 | -341 | -1,175 |
| 2023 | -741 | -1,288 | -308 | -1,262 | -93 | -199 | -645 | -450 | -722 | -234 | -396 | 124 |
| 2024 | -489 | |||||||||||
| - = No Data Reported; -- = Not Applicable; NA = Not Available; W = Withheld to avoid disclosure of individual company data. |
| Release Date: 3/29/2024 |
| Next Release Date: 4/30/2024 |