|
Download Data (XLS File) |
|
||||||||
|
||||||||
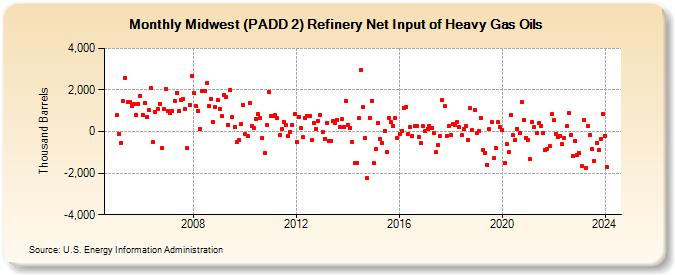
| Midwest (PADD 2) Refinery Net Input of Heavy Gas Oils (Thousand Barrels) | ||||||||
| Year | Jan | Feb | Mar | Apr | May | Jun | Jul | Aug | Sep | Oct | Nov | Dec |
|---|---|---|---|---|---|---|---|---|---|---|---|---|
| 2005 | 780 | -100 | -559 | 1,460 | 2,596 | 1,418 | 1,438 | 1,230 | 1,310 | 788 | 1,317 | 1,727 |
| 2006 | 809 | 1,385 | 697 | 1,030 | 2,087 | -521 | 930 | 1,106 | 1,341 | -771 | 1,105 | 2,060 |
| 2007 | 979 | 884 | 1,010 | 1,475 | 1,868 | 980 | 1,535 | 1,585 | 1,063 | -815 | 1,298 | 2,655 |
| 2008 | 1,859 | 1,216 | 995 | 133 | 1,957 | 1,939 | 2,325 | 1,235 | 1,585 | 461 | 1,176 | 1,513 |
| 2009 | 1,082 | 747 | 1,754 | 1,680 | 328 | 2,012 | 682 | 239 | -484 | -416 | 354 | 1,283 |
| 2010 | -139 | -203 | 1,394 | 262 | 176 | 616 | 855 | 659 | -320 | -1,036 | 317 | 1,904 |
| 2011 | 772 | 733 | 800 | 637 | -186 | 115 | 477 | 314 | -207 | -2 | 296 | 860 |
| 2012 | -511 | 700 | 152 | -282 | 669 | 760 | 740 | -413 | 404 | 114 | 529 | 820 |
| 2013 | -5 | -343 | 422 | -452 | -436 | 530 | 392 | 572 | 213 | 603 | 233 | 1,481 |
| 2014 | 321 | 176 | -504 | -1,490 | -1,507 | 633 | 2,964 | 1,168 | -319 | -2,235 | 673 | 1,486 |
| 2015 | -1,524 | -847 | 426 | -367 | -540 | 20 | -1,002 | 642 | 450 | 268 | 655 | -307 |
| 2016 | -105 | 47 | 1,143 | 1,179 | -131 | 211 | -211 | 272 | 250 | -262 | -531 | 252 |
| 2017 | 11 | 129 | 260 | 162 | -64 | -1,001 | -654 | -201 | 1,522 | 1,214 | -215 | 262 |
| 2018 | -147 | 364 | 295 | 469 | 197 | -188 | 132 | 261 | -417 | 1,109 | 52 | 1,019 |
| 2019 | -93 | 34 | 668 | -869 | -1,014 | -1,593 | 107 | 455 | -1,291 | -781 | 456 | 211 |
| 2020 | 72 | -1,503 | -590 | -974 | 782 | -177 | -385 | 126 | -63 | 1,418 | 570 | -293 |
| 2021 | -423 | -1,334 | 445 | 198 | -54 | 396 | 283 | -56 | -872 | -842 | -709 | 841 |
| 2022 | 546 | -104 | -250 | -205 | -596 | -320 | 251 | 890 | -159 | -1,177 | -438 | -1,128 |
| 2023 | -1,020 | -1,634 | 551 | -1,755 | 252 | -149 | -857 | -1,409 | -540 | -888 | -367 | 858 |
| 2024 | -194 | |||||||||||
| - = No Data Reported; -- = Not Applicable; NA = Not Available; W = Withheld to avoid disclosure of individual company data. |
| Release Date: 3/29/2024 |
| Next Release Date: 4/30/2024 |