|
Download Data (XLS File) |
|
||||||||
|
||||||||
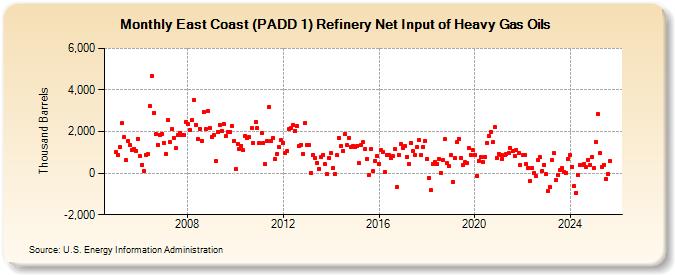
| East Coast (PADD 1) Refinery Net Input of Heavy Gas Oils (Thousand Barrels) | ||||||||
| Year | Jan | Feb | Mar | Apr | May | Jun | Jul | Aug | Sep | Oct | Nov | Dec |
|---|---|---|---|---|---|---|---|---|---|---|---|---|
| 2005 | 1,014 | 869 | 1,234 | 2,391 | 1,734 | 619 | 1,551 | 1,361 | 1,135 | 1,165 | 1,082 | 1,656 |
| 2006 | 803 | 404 | 99 | 891 | 911 | 3,235 | 4,660 | 2,915 | 1,867 | 1,354 | 1,848 | 1,906 |
| 2007 | 1,464 | 934 | 2,534 | 1,518 | 2,128 | 1,705 | 1,185 | 1,857 | 1,923 | 1,842 | 1,850 | 2,458 |
| 2008 | 2,368 | 2,055 | 2,546 | 3,535 | 2,329 | 1,635 | 2,144 | 1,562 | 2,954 | 2,102 | 2,995 | 2,186 |
| 2009 | 1,754 | 1,848 | 561 | 1,992 | 2,335 | 2,041 | 2,372 | 1,766 | 1,991 | 1,965 | 2,271 | 1,535 |
| 2010 | 190 | 1,414 | 1,181 | 1,320 | 1,098 | 1,808 | 1,673 | 1,733 | 2,179 | 1,469 | 2,464 | 2,169 |
| 2011 | 1,455 | 1,952 | 1,450 | 418 | 1,537 | 3,199 | 1,548 | 1,687 | 665 | 934 | 1,246 | 1,572 |
| 2012 | 1,462 | 991 | 1,066 | 2,134 | 2,159 | 2,336 | 2,045 | 2,269 | 1,301 | 1,375 | 935 | 2,416 |
| 2013 | 1,338 | 1,362 | 16 | 892 | 729 | 503 | 209 | 771 | 895 | 420 | -22 | 714 |
| 2014 | 958 | 269 | -45 | 855 | 1,709 | 1,298 | 1,063 | 1,860 | 1,352 | 1,707 | 1,277 | 1,327 |
| 2015 | 1,281 | 1,321 | 499 | 1,349 | 1,480 | 1,171 | 702 | -95 | 1,144 | 85 | 596 | 809 |
| 2016 | 451 | 1,110 | 1,036 | 77 | 870 | 888 | 724 | 801 | 1,150 | -666 | 878 | 1,406 |
| 2017 | 1,229 | 1,295 | 791 | 432 | 1,466 | 1,072 | 880 | 1,258 | 1,594 | 876 | 1,275 | 1,550 |
| 2018 | 698 | -216 | -828 | 447 | 542 | 429 | 694 | 3 | 609 | 1,621 | 473 | 328 |
| 2019 | 849 | -404 | 720 | 1,477 | 1,642 | 748 | 393 | 515 | 468 | 1,187 | 893 | 1,118 |
| 2020 | 889 | -139 | 592 | 752 | 537 | 772 | 1,456 | 1,791 | 1,985 | 1,474 | 2,196 | 746 |
| 2021 | 941 | 885 | 702 | 858 | 922 | 974 | 1,197 | 1,062 | 842 | 1,123 | 976 | 399 |
| 2022 | 853 | 896 | 436 | 262 | -376 | 249 | 11 | -153 | 623 | 757 | 121 | 415 |
| 2023 | -48 | -876 | -668 | 622 | 961 | -339 | -76 | 128 | 244 | 50 | 30 | 678 |
| 2024 | 861 | 309 | -626 | -935 | -131 | 368 | ||||||
| - = No Data Reported; -- = Not Applicable; NA = Not Available; W = Withheld to avoid disclosure of individual company data. |
| Release Date: 8/30/2024 |
| Next Release Date: 9/30/2024 |