|
Download Data (XLS File) |
|
||||||||
|
||||||||
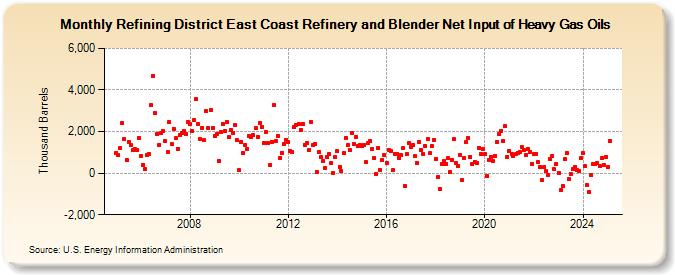
| Refining District East Coast Refinery and Blender Net Input of Heavy Gas Oils (Thousand Barrels) | ||||||||
| Year | Jan | Feb | Mar | Apr | May | Jun | Jul | Aug | Sep | Oct | Nov | Dec |
|---|---|---|---|---|---|---|---|---|---|---|---|---|
| 2005 | 991 | 869 | 1,197 | 2,414 | 1,641 | 641 | 1,508 | 1,343 | 1,112 | 1,137 | 1,115 | 1,684 |
| 2006 | 811 | 406 | 189 | 879 | 909 | 3,280 | 4,694 | 2,902 | 1,899 | 1,368 | 1,907 | 2,021 |
| 2007 | 1,554 | 1,033 | 2,468 | 1,391 | 2,140 | 1,675 | 1,183 | 1,836 | 1,910 | 2,027 | 1,861 | 2,437 |
| 2008 | 2,341 | 2,036 | 2,566 | 3,564 | 2,386 | 1,640 | 2,185 | 1,582 | 2,974 | 2,153 | 3,014 | 2,178 |
| 2009 | 1,789 | 1,893 | 573 | 1,985 | 2,362 | 2,010 | 2,454 | 1,751 | 2,088 | 1,950 | 2,310 | 1,600 |
| 2010 | 136 | 1,503 | 973 | 1,354 | 1,170 | 1,775 | 1,724 | 1,815 | 2,152 | 1,753 | 2,427 | 2,231 |
| 2011 | 1,446 | 1,988 | 1,473 | 403 | 1,520 | 3,268 | 1,557 | 1,799 | 738 | 987 | 1,389 | 1,614 |
| 2012 | 1,497 | 1,085 | 1,022 | 2,210 | 2,329 | 2,356 | 2,067 | 2,353 | 1,367 | 1,440 | 1,104 | 2,482 |
| 2013 | 1,352 | 1,417 | 66 | 1,011 | 761 | 585 | 259 | 779 | 927 | 480 | 22 | 779 |
| 2014 | 1,045 | 287 | 89 | 966 | 1,690 | 1,352 | 1,118 | 1,916 | 1,385 | 1,745 | 1,311 | 1,370 |
| 2015 | 1,314 | 1,354 | 530 | 1,444 | 1,524 | 1,163 | 733 | -32 | 1,223 | 147 | 630 | 856 |
| 2016 | 494 | 1,121 | 1,081 | 132 | 944 | 929 | 748 | 869 | 1,185 | -623 | 909 | 1,438 |
| 2017 | 1,266 | 1,351 | 818 | 481 | 1,506 | 1,111 | 910 | 1,302 | 1,657 | 953 | 1,329 | 1,602 |
| 2018 | 682 | -171 | -746 | 462 | 564 | 458 | 721 | 44 | 647 | 1,634 | 465 | 346 |
| 2019 | 873 | -347 | 723 | 1,498 | 1,687 | 781 | 433 | 544 | 504 | 1,225 | 922 | 1,167 |
| 2020 | 919 | -115 | 644 | 789 | 591 | 832 | 1,517 | 1,859 | 2,025 | 1,537 | 2,250 | 799 |
| 2021 | 1,065 | 907 | 802 | 897 | 986 | 1,026 | 1,252 | 1,095 | 886 | 1,184 | 1,019 | 461 |
| 2022 | 909 | 943 | 547 | 288 | -334 | 283 | 87 | -90 | 681 | 804 | 186 | 449 |
| 2023 | 21 | -822 | -623 | 675 | 987 | -303 | -45 | 182 | 316 | 129 | 89 | 714 |
| 2024 | 946 | |||||||||||
| - = No Data Reported; -- = Not Applicable; NA = Not Available; W = Withheld to avoid disclosure of individual company data. |
| Release Date: 3/29/2024 |
| Next Release Date: 4/30/2024 |