|
Download Data (XLS File) |
|
||||||||
|
||||||||
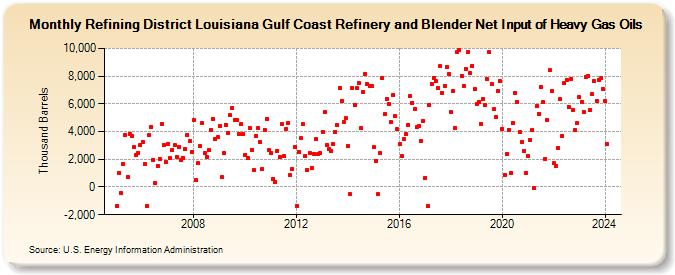
| Refining District Louisiana Gulf Coast Refinery and Blender Net Input of Heavy Gas Oils (Thousand Barrels) | ||||||||
| Year | Jan | Feb | Mar | Apr | May | Jun | Jul | Aug | Sep | Oct | Nov | Dec |
|---|---|---|---|---|---|---|---|---|---|---|---|---|
| 2005 | -1,368 | 1,033 | -448 | 1,647 | 3,777 | 738 | 3,850 | 3,715 | 2,885 | 2,291 | 2,470 | 3,044 |
| 2006 | 3,252 | 1,657 | -1,406 | 3,717 | 4,349 | 1,978 | 263 | 1,533 | 2,027 | 4,571 | 3,044 | 1,789 |
| 2007 | 3,121 | 2,106 | 2,703 | 2,994 | 2,196 | 2,855 | 1,955 | 2,080 | 2,706 | 3,762 | 3,286 | 2,509 |
| 2008 | 4,809 | 495 | 1,727 | 2,956 | 4,624 | 2,478 | 2,194 | 2,660 | 4,137 | 4,903 | 3,458 | 3,586 |
| 2009 | 4,404 | 701 | 2,425 | 4,497 | 3,863 | 5,171 | 5,708 | 4,847 | 4,801 | 3,797 | 4,524 | 3,816 |
| 2010 | 2,344 | 2,058 | 4,289 | 2,688 | 1,235 | 3,666 | 4,258 | 3,232 | 1,303 | 4,141 | 4,916 | 2,639 |
| 2011 | 2,475 | 601 | 371 | 2,625 | 2,145 | 4,557 | 2,211 | 4,208 | 4,646 | 831 | 1,281 | 2,867 |
| 2012 | -1,354 | 2,503 | 3,513 | 4,522 | 2,240 | 1,218 | 2,465 | 1,391 | 2,408 | 3,468 | 2,356 | 2,417 |
| 2013 | 3,959 | 5,445 | 3,040 | 2,713 | 2,572 | 3,097 | 3,994 | 4,465 | 7,155 | 6,224 | 4,719 | 4,958 |
| 2014 | 2,992 | -527 | 7,108 | 5,931 | 7,119 | 7,491 | 4,243 | 6,869 | 8,138 | 7,423 | 7,317 | 7,270 |
| 2015 | 2,852 | 1,863 | -531 | 2,463 | 7,850 | 5,261 | 6,379 | 5,969 | 4,663 | 6,652 | 5,098 | 4,155 |
| 2016 | 3,071 | 2,251 | 3,446 | 3,809 | 4,490 | 6,577 | 6,060 | 5,593 | 4,293 | 4,424 | 3,305 | 4,781 |
| 2017 | 663 | -1,358 | 5,944 | 7,464 | 7,890 | 7,639 | 7,165 | 8,711 | 6,777 | 7,275 | 8,660 | 8,167 |
| 2018 | 5,387 | 6,935 | 4,271 | 9,755 | 9,849 | 8,028 | 7,313 | 8,543 | 9,752 | 8,217 | 8,763 | 7,043 |
| 2019 | 5,963 | 6,151 | 4,558 | 6,351 | 5,930 | 7,767 | 9,727 | 7,411 | 5,594 | 5,026 | 6,960 | 7,620 |
| 2020 | 4,196 | 871 | 2,372 | 4,148 | 1,006 | 4,606 | 6,814 | 6,150 | 3,932 | 3,273 | 2,630 | 1,005 |
| 2021 | 2,229 | 3,406 | 4,141 | -56 | 5,839 | 5,301 | 7,244 | 6,099 | 2,033 | 4,819 | 8,409 | 6,914 |
| 2022 | 1,706 | 1,522 | 2,818 | 6,326 | 3,707 | 7,479 | 7,737 | 5,792 | 7,767 | 5,528 | 4,097 | 4,590 |
| 2023 | 6,467 | 6,152 | 5,400 | 7,944 | 7,995 | 5,589 | 6,692 | 7,645 | 6,240 | 7,730 | 7,847 | 7,090 |
| 2024 | 6,182 | 3,097 | ||||||||||
| - = No Data Reported; -- = Not Applicable; NA = Not Available; W = Withheld to avoid disclosure of individual company data. |
| Release Date: 4/30/2024 |
| Next Release Date: 5/31/2024 |