|
Download Data (XLS File) |
|
||||||||
|
||||||||
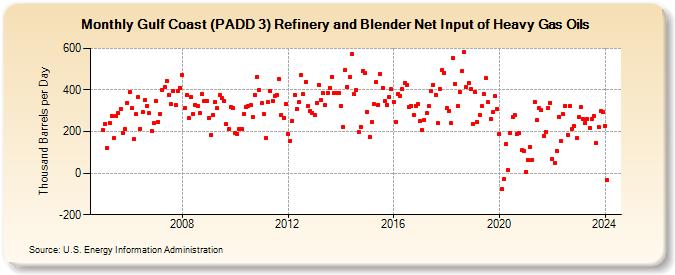
| Gulf Coast (PADD 3) Refinery and Blender Net Input of Heavy Gas Oils (Thousand Barrels per Day) | ||||||||
| Year | Jan | Feb | Mar | Apr | May | Jun | Jul | Aug | Sep | Oct | Nov | Dec |
|---|---|---|---|---|---|---|---|---|---|---|---|---|
| 2005 | 207 | 237 | 120 | 242 | 275 | 170 | 277 | 287 | 310 | 195 | 210 | 339 |
| 2006 | 390 | 312 | 164 | 283 | 364 | 214 | 292 | 350 | 325 | 288 | 203 | 240 |
| 2007 | 347 | 248 | 286 | 398 | 416 | 444 | 374 | 331 | 395 | 327 | 393 | 411 |
| 2008 | 472 | 312 | 376 | 263 | 366 | 283 | 329 | 325 | 287 | 381 | 346 | 345 |
| 2009 | 266 | 185 | 281 | 344 | 311 | 374 | 359 | 348 | 234 | 212 | 318 | 313 |
| 2010 | 193 | 190 | 214 | 210 | 284 | 317 | 321 | 328 | 271 | 377 | 464 | 400 |
| 2011 | 336 | 285 | 171 | 340 | 395 | 349 | 372 | 376 | 452 | 279 | 266 | 334 |
| 2012 | 188 | 155 | 252 | 376 | 309 | 341 | 474 | 380 | 440 | 322 | 299 | 291 |
| 2013 | 278 | 339 | 425 | 352 | 384 | 327 | 386 | 411 | 464 | 385 | 387 | 386 |
| 2014 | 324 | 222 | 495 | 415 | 462 | 573 | 380 | 400 | 198 | 224 | 493 | 481 |
| 2015 | 296 | 176 | 246 | 331 | 438 | 329 | 478 | 410 | 348 | 328 | 365 | 403 |
| 2016 | 344 | 247 | 383 | 373 | 403 | 435 | 424 | 318 | 322 | 282 | 323 | 332 |
| 2017 | 250 | 207 | 255 | 287 | 322 | 395 | 426 | 376 | 241 | 407 | 495 | 483 |
| 2018 | 311 | 300 | 239 | 553 | 428 | 324 | 391 | 489 | 582 | 415 | 435 | 404 |
| 2019 | 236 | 388 | 246 | 280 | 322 | 380 | 456 | 340 | 261 | 292 | 369 | 309 |
| 2020 | 188 | -77 | -30 | 141 | 13 | 194 | 269 | 278 | 189 | 195 | 109 | 107 |
| 2021 | 6 | 62 | 128 | 64 | 344 | 254 | 312 | 302 | 180 | 200 | 311 | 338 |
| 2022 | 70 | 51 | 108 | 270 | 153 | 283 | 325 | 185 | 324 | 212 | 227 | 170 |
| 2023 | 268 | 318 | 261 | 242 | 260 | 218 | 261 | 274 | 144 | 221 | 298 | 294 |
| 2024 | 228 | |||||||||||
| - = No Data Reported; -- = Not Applicable; NA = Not Available; W = Withheld to avoid disclosure of individual company data. |
| Release Date: 3/29/2024 |
| Next Release Date: 4/30/2024 |