|
Download Data (XLS File) |
|
||||||||
|
||||||||
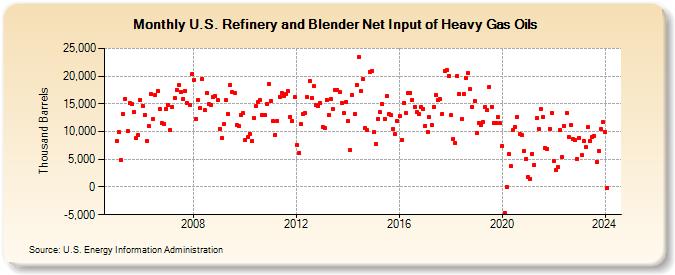
| U.S. Refinery and Blender Net Input of Heavy Gas Oils (Thousand Barrels) | ||||||||
| Year | Jan | Feb | Mar | Apr | May | Jun | Jul | Aug | Sep | Oct | Nov | Dec |
|---|---|---|---|---|---|---|---|---|---|---|---|---|
| 2005 | 8,234 | 9,848 | 4,798 | 13,151 | 15,952 | 10,132 | 15,118 | 14,897 | 13,573 | 8,800 | 9,370 | 15,773 |
| 2006 | 14,619 | 13,051 | 8,337 | 11,045 | 16,744 | 12,327 | 16,601 | 17,271 | 14,111 | 11,538 | 11,417 | 14,152 |
| 2007 | 14,725 | 10,256 | 14,420 | 16,049 | 17,569 | 18,328 | 17,128 | 15,930 | 17,303 | 15,086 | 14,816 | 20,306 |
| 2008 | 19,358 | 12,254 | 15,716 | 14,283 | 19,529 | 13,907 | 16,924 | 14,900 | 14,807 | 16,191 | 16,373 | 15,652 |
| 2009 | 10,548 | 8,925 | 11,318 | 15,635 | 13,187 | 18,382 | 17,065 | 17,038 | 11,136 | 10,929 | 13,026 | 13,338 |
| 2010 | 8,479 | 8,941 | 9,630 | 8,295 | 12,526 | 14,568 | 15,249 | 15,659 | 13,040 | 12,928 | 15,058 | 18,637 |
| 2011 | 15,527 | 11,822 | 9,460 | 11,991 | 16,310 | 17,027 | 16,494 | 16,722 | 17,289 | 12,697 | 11,816 | 16,147 |
| 2012 | 7,580 | 6,215 | 11,351 | 13,128 | 13,383 | 16,205 | 19,062 | 16,103 | 18,152 | 14,701 | 14,626 | 15,189 |
| 2013 | 10,905 | 10,599 | 15,769 | 12,950 | 15,850 | 13,995 | 17,566 | 17,552 | 17,152 | 15,133 | 13,283 | 15,302 |
| 2014 | 11,911 | 6,644 | 16,658 | 13,154 | 18,455 | 23,458 | 17,308 | 19,407 | 10,672 | 10,222 | 20,712 | 20,968 |
| 2015 | 9,900 | 7,753 | 12,310 | 13,478 | 14,945 | 12,328 | 16,378 | 13,149 | 12,909 | 10,482 | 9,552 | 11,925 |
| 2016 | 12,822 | 8,494 | 15,123 | 13,301 | 16,944 | 16,985 | 15,697 | 14,488 | 13,544 | 13,109 | 14,340 | 14,105 |
| 2017 | 11,050 | 9,901 | 12,617 | 11,203 | 14,474 | 16,594 | 15,698 | 15,819 | 13,256 | 20,890 | 21,050 | 20,052 |
| 2018 | 12,953 | 8,675 | 7,970 | 19,974 | 16,860 | 12,322 | 16,777 | 19,715 | 20,552 | 17,621 | 14,416 | 15,560 |
| 2019 | 9,734 | 11,551 | 11,128 | 11,729 | 14,341 | 13,809 | 18,102 | 14,489 | 11,460 | 11,562 | 12,627 | 11,482 |
| 2020 | 7,429 | -4,618 | 86 | 5,895 | 3,760 | 10,311 | 10,807 | 12,666 | 9,477 | 9,332 | 6,522 | 5,055 |
| 2021 | 1,802 | 1,486 | 6,017 | 3,959 | 12,429 | 10,466 | 14,012 | 12,693 | 7,078 | 6,869 | 10,534 | 13,364 |
| 2022 | 4,637 | 3,091 | 3,585 | 10,197 | 5,434 | 11,041 | 13,334 | 9,047 | 11,179 | 8,608 | 8,469 | 5,037 |
| 2023 | 8,923 | 5,687 | 8,332 | 7,209 | 10,743 | 8,372 | 9,008 | 9,207 | 4,588 | 6,539 | 10,386 | 11,659 |
| 2024 | 9,979 | |||||||||||
| - = No Data Reported; -- = Not Applicable; NA = Not Available; W = Withheld to avoid disclosure of individual company data. |
| Release Date: 3/29/2024 |
| Next Release Date: 4/30/2024 |