|
Download Data (XLS File) |
|
||||||||
|
||||||||
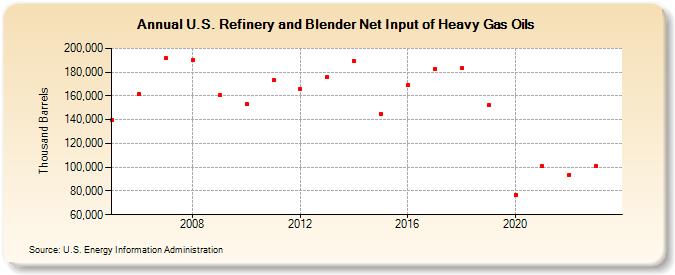
| U.S. Refinery and Blender Net Input of Heavy Gas Oils (Thousand Barrels) | ||||||||
| Decade | Year-0 | Year-1 | Year-2 | Year-3 | Year-4 | Year-5 | Year-6 | Year-7 | Year-8 | Year-9 |
|---|---|---|---|---|---|---|---|---|---|---|
| 2000's | 139,646 | 161,213 | 191,916 | 189,894 | 160,527 | |||||
| 2010's | 153,010 | 173,302 | 165,695 | 176,056 | 189,569 | 145,109 | 168,952 | 182,604 | 183,395 | 152,014 |
| 2020's | 76,722 | 100,709 | 93,659 | 100,653 |
| - = No Data Reported; -- = Not Applicable; NA = Not Available; W = Withheld to avoid disclosure of individual company data. |
| Release Date: 3/29/2024 |
| Next Release Date: 8/30/2024 |