|
Download Data (XLS File) |
|
||||||||
|
||||||||
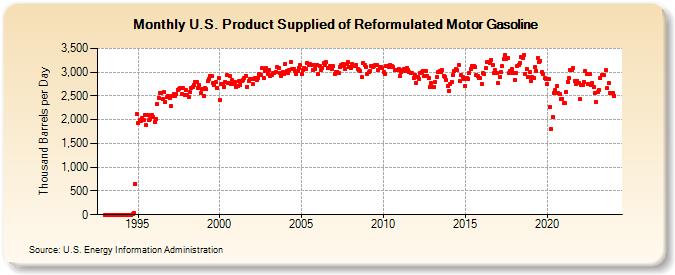
| U.S. Product Supplied of Reformulated Motor Gasoline (Thousand Barrels per Day) | ||||||||
| Year | Jan | Feb | Mar | Apr | May | Jun | Jul | Aug | Sep | Oct | Nov | Dec |
|---|---|---|---|---|---|---|---|---|---|---|---|---|
| 1993 | 0 | 0 | 0 | 0 | 0 | 0 | 0 | 0 | 0 | 0 | 0 | 0 |
| 1994 | 0 | 0 | 0 | 0 | 0 | 0 | 0 | 0 | 9 | 32 | 654 | 2,116 |
| 1995 | 1,929 | 1,999 | 1,976 | 2,028 | 1,996 | 2,093 | 1,881 | 2,107 | 1,992 | 2,022 | 2,101 | 2,056 |
| 1996 | 1,958 | 2,014 | 2,321 | 2,460 | 2,562 | 2,559 | 2,428 | 2,575 | 2,364 | 2,475 | 2,493 | 2,454 |
| 1997 | 2,283 | 2,490 | 2,530 | 2,504 | 2,543 | 2,632 | 2,648 | 2,665 | 2,531 | 2,657 | 2,527 | 2,614 |
| 1998 | 2,518 | 2,483 | 2,575 | 2,675 | 2,698 | 2,725 | 2,793 | 2,783 | 2,662 | 2,727 | 2,558 | 2,652 |
| 1999 | 2,489 | 2,665 | 2,636 | 2,807 | 2,865 | 2,926 | 2,920 | 2,765 | 2,724 | 2,784 | 2,673 | 2,883 |
| 2000 | 2,416 | 2,748 | 2,742 | 2,698 | 2,791 | 2,934 | 2,779 | 2,909 | 2,742 | 2,825 | 2,757 | 2,803 |
| 2001 | 2,680 | 2,716 | 2,805 | 2,732 | 2,821 | 2,831 | 2,874 | 2,919 | 2,695 | 2,804 | 2,861 | 2,857 |
| 2002 | 2,751 | 2,854 | 2,870 | 2,833 | 2,870 | 2,968 | 2,943 | 3,077 | 2,869 | 3,015 | 3,094 | 2,959 |
| 2003 | 3,054 | 2,924 | 2,943 | 2,972 | 2,986 | 3,006 | 3,111 | 3,085 | 2,974 | 2,922 | 3,003 | 2,956 |
| 2004 | 3,181 | 3,017 | 2,977 | 3,037 | 3,207 | 3,073 | 3,070 | 3,025 | 2,971 | 3,021 | 3,095 | 3,143 |
| 2005 | 2,957 | 3,038 | 3,094 | 3,072 | 3,196 | 3,145 | 3,168 | 3,158 | 3,036 | 3,143 | 3,075 | 3,158 |
| 2006 | 2,952 | 3,129 | 3,035 | 3,077 | 3,185 | 3,151 | 3,207 | 3,085 | 3,089 | 3,123 | 3,075 | 3,128 |
| 2007 | 2,967 | 3,004 | 3,011 | 2,992 | 3,110 | 3,157 | 3,171 | 3,137 | 3,075 | 3,163 | 3,211 | 3,105 |
| 2008 | 3,082 | 3,171 | 3,139 | 3,124 | 3,157 | 3,063 | 3,046 | 3,027 | 2,889 | 3,193 | 3,141 | 3,114 |
| 2009 | 2,960 | 2,995 | 3,015 | 3,130 | 3,107 | 3,126 | 3,148 | 3,141 | 3,038 | 3,101 | 3,116 | 3,082 |
| 2010 | 2,996 | 2,959 | 3,131 | 3,132 | 3,112 | 3,154 | 3,139 | 3,105 | 3,047 | 3,035 | 3,035 | 3,057 |
| 2011 | 2,918 | 2,997 | 3,046 | 3,057 | 3,023 | 3,084 | 3,037 | 2,996 | 2,981 | 2,972 | 2,882 | 2,950 |
| 2012 | 2,782 | 2,898 | 2,860 | 2,984 | 3,000 | 3,025 | 2,916 | 3,024 | 2,915 | 2,873 | 2,683 | 2,765 |
| 2013 | 2,688 | 2,687 | 2,796 | 2,905 | 3,003 | 3,019 | 3,000 | 3,048 | 2,919 | 2,891 | 2,836 | 2,699 |
| 2014 | 2,610 | 2,747 | 2,803 | 2,941 | 3,029 | 3,058 | 3,046 | 3,147 | 2,812 | 2,949 | 2,893 | 2,866 |
| 2015 | 2,719 | 2,880 | 2,857 | 2,989 | 3,068 | 3,139 | 3,137 | 3,116 | 2,942 | 2,909 | 2,881 | 2,872 |
| 2016 | 2,753 | 2,976 | 2,970 | 3,081 | 3,205 | 3,210 | 3,183 | 3,264 | 3,144 | 2,989 | 3,035 | 2,979 |
| 2017 | 2,773 | 2,895 | 3,003 | 3,121 | 3,280 | 3,361 | 3,279 | 3,303 | 2,973 | 3,020 | 3,065 | 2,991 |
| 2018 | 2,843 | 2,992 | 3,122 | 3,151 | 3,200 | 3,320 | 3,291 | 3,356 | 2,968 | 3,066 | 2,906 | 2,995 |
| 2019 | 2,821 | 2,894 | 2,881 | 3,105 | 3,026 | 3,303 | 3,207 | 3,235 | 3,000 | 2,965 | 2,868 | 2,854 |
| 2020 | 2,745 | 2,861 | 2,270 | 1,800 | 2,059 | 2,565 | 2,630 | 2,712 | 2,560 | 2,535 | 2,430 | 2,445 |
| 2021 | 2,343 | 2,353 | 2,592 | 2,799 | 2,873 | 3,046 | 3,044 | 3,092 | 2,813 | 2,761 | 2,824 | 2,778 |
| 2022 | 2,429 | 2,725 | 2,722 | 2,797 | 3,016 | 2,969 | 2,760 | 2,965 | 2,738 | 2,773 | 2,680 | 2,558 |
| 2023 | 2,378 | 2,578 | 2,634 | 2,871 | 2,941 | 2,941 | 2,931 | 3,036 | 2,663 | 2,770 | 2,559 | 2,568 |
| 2024 | 2,558 | |||||||||||
| - = No Data Reported; -- = Not Applicable; NA = Not Available; W = Withheld to avoid disclosure of individual company data. |
| Release Date: 3/29/2024 |
| Next Release Date: 4/30/2024 |