|
Download Data (XLS File) |
|
||||||||
|
||||||||
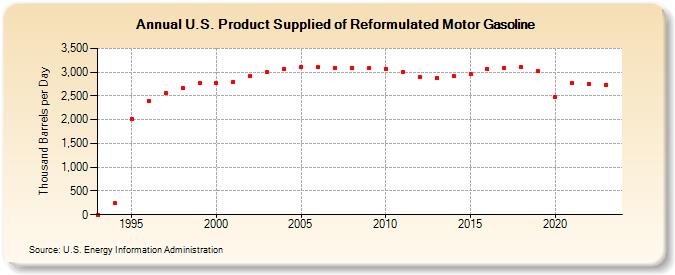
| U.S. Product Supplied of Reformulated Motor Gasoline (Thousand Barrels per Day) | ||||||||
| Decade | Year-0 | Year-1 | Year-2 | Year-3 | Year-4 | Year-5 | Year-6 | Year-7 | Year-8 | Year-9 |
|---|---|---|---|---|---|---|---|---|---|---|
| 1990's | 0 | 237 | 2,015 | 2,390 | 2,552 | 2,656 | 2,762 | |||
| 2000's | 2,762 | 2,800 | 2,926 | 2,995 | 3,069 | 3,104 | 3,103 | 3,092 | 3,096 | 3,080 |
| 2010's | 3,076 | 2,995 | 2,894 | 2,875 | 2,910 | 2,959 | 3,066 | 3,090 | 3,102 | 3,014 |
| 2020's | 2,467 | 2,779 | 2,761 | 2,740 |
| - = No Data Reported; -- = Not Applicable; NA = Not Available; W = Withheld to avoid disclosure of individual company data. |
| Release Date: 3/29/2024 |
| Next Release Date: 8/30/2024 |