|
Download Data (XLS File) |
|
||||||||
|
||||||||
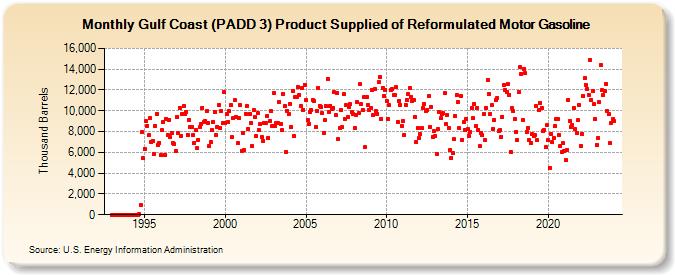
| Gulf Coast (PADD 3) Product Supplied of Reformulated Motor Gasoline (Thousand Barrels) | ||||||||
| Year | Jan | Feb | Mar | Apr | May | Jun | Jul | Aug | Sep | Oct | Nov | Dec |
|---|---|---|---|---|---|---|---|---|---|---|---|---|
| 1993 | 0 | 0 | 0 | 0 | 0 | 0 | 0 | 0 | 0 | 0 | 0 | 0 |
| 1994 | 0 | 0 | 0 | 0 | 0 | 0 | 0 | 0 | 84 | 917 | 7,937 | 5,411 |
| 1995 | 6,366 | 8,971 | 8,561 | 7,632 | 9,287 | 6,971 | 7,138 | 5,846 | 8,520 | 9,718 | 6,746 | 6,937 |
| 1996 | 5,717 | 8,106 | 8,909 | 5,768 | 9,216 | 7,691 | 9,146 | 7,470 | 7,838 | 6,890 | 6,804 | 6,105 |
| 1997 | 9,414 | 7,840 | 10,252 | 7,574 | 9,714 | 10,439 | 9,723 | 9,924 | 7,716 | 9,151 | 8,390 | 8,454 |
| 1998 | 7,667 | 6,945 | 8,184 | 6,383 | 7,213 | 8,434 | 8,704 | 10,298 | 8,900 | 9,032 | 9,955 | 8,869 |
| 1999 | 6,609 | 6,985 | 8,195 | 8,941 | 9,906 | 7,669 | 8,472 | 10,544 | 8,345 | 9,935 | 8,801 | 11,804 |
| 2000 | 8,799 | 9,654 | 8,899 | 9,947 | 10,538 | 7,438 | 9,305 | 11,022 | 9,446 | 6,859 | 9,309 | 10,578 |
| 2001 | 6,142 | 7,896 | 6,209 | 9,720 | 10,448 | 8,274 | 9,723 | 8,861 | 6,626 | 10,065 | 9,376 | 7,592 |
| 2002 | 9,780 | 8,102 | 8,748 | 7,453 | 7,118 | 8,842 | 8,792 | 9,502 | 7,391 | 9,051 | 9,948 | 8,494 |
| 2003 | 11,727 | 8,546 | 8,819 | 8,793 | 10,861 | 8,749 | 8,108 | 11,584 | 10,450 | 6,064 | 9,959 | 9,685 |
| 2004 | 10,675 | 8,450 | 11,909 | 7,589 | 11,360 | 11,296 | 12,278 | 11,547 | 10,464 | 12,160 | 10,121 | 12,507 |
| 2005 | 11,028 | 9,109 | 8,712 | 9,842 | 10,083 | 11,065 | 10,899 | 8,437 | 10,017 | 12,216 | 10,496 | 10,399 |
| 2006 | 9,745 | 7,817 | 9,094 | 10,437 | 13,069 | 9,881 | 10,506 | 10,151 | 10,277 | 11,760 | 9,552 | 11,736 |
| 2007 | 7,251 | 8,345 | 10,055 | 8,424 | 11,568 | 9,245 | 10,543 | 9,371 | 10,404 | 10,614 | 9,863 | 9,669 |
| 2008 | 8,378 | 9,627 | 10,820 | 9,757 | 12,527 | 10,624 | 10,105 | 11,282 | 6,500 | 11,279 | 10,586 | 10,065 |
| 2009 | 10,298 | 11,994 | 9,604 | 12,102 | 9,984 | 9,715 | 12,732 | 13,228 | 9,238 | 12,228 | 11,423 | 12,044 |
| 2010 | 10,892 | 9,184 | 10,528 | 11,959 | 12,135 | 11,497 | 11,527 | 12,239 | 8,961 | 10,969 | 10,571 | 8,577 |
| 2011 | 8,988 | 7,689 | 10,591 | 11,055 | 11,626 | 12,200 | 11,346 | 10,973 | 11,028 | 9,418 | 7,004 | 8,370 |
| 2012 | 7,374 | 7,764 | 8,314 | 10,309 | 10,638 | 9,977 | 10,050 | 11,385 | 8,483 | 10,340 | 7,511 | 8,074 |
| 2013 | 7,582 | 5,888 | 8,209 | 9,883 | 9,261 | 9,659 | 9,745 | 11,661 | 8,716 | 9,616 | 8,350 | 6,193 |
| 2014 | 5,467 | 5,900 | 7,252 | 9,492 | 11,522 | 10,820 | 8,300 | 11,402 | 7,222 | 8,879 | 8,181 | 9,232 |
| 2015 | 8,208 | 7,605 | 7,987 | 10,279 | 9,264 | 10,691 | 8,516 | 10,225 | 8,194 | 6,586 | 7,887 | 7,640 |
| 2016 | 9,696 | 7,209 | 10,281 | 12,954 | 11,613 | 9,697 | 10,530 | 8,249 | 9,118 | 11,047 | 11,203 | 8,034 |
| 2017 | 8,138 | 7,465 | 9,430 | 12,468 | 12,038 | 11,762 | 12,551 | 11,549 | 6,062 | 10,220 | 9,929 | 9,186 |
| 2018 | 7,992 | 7,203 | 11,782 | 14,180 | 13,573 | 9,144 | 14,021 | 13,593 | 7,970 | 8,355 | 7,142 | 6,911 |
| 2019 | 7,757 | 7,558 | 7,689 | 10,427 | 7,148 | 10,068 | 10,794 | 10,252 | 8,014 | 8,141 | 6,476 | 8,597 |
| 2020 | 7,160 | 4,518 | 7,801 | 6,967 | 7,392 | 8,576 | 9,170 | 9,174 | 7,687 | 6,651 | 6,005 | 6,857 |
| 2021 | 6,169 | 5,240 | 6,267 | 11,032 | 9,029 | 8,423 | 8,657 | 10,259 | 8,243 | 7,889 | 9,072 | 10,564 |
| 2022 | 6,599 | 7,756 | 11,465 | 13,130 | 12,511 | 12,140 | 11,533 | 14,910 | 11,040 | 11,913 | 10,610 | 9,226 |
| 2023 | 6,746 | 7,380 | 10,855 | 14,417 | 11,971 | 11,493 | 11,853 | 12,594 | 9,942 | 9,651 | 6,913 | 8,865 |
| 2024 | 9,181 | |||||||||||
| - = No Data Reported; -- = Not Applicable; NA = Not Available; W = Withheld to avoid disclosure of individual company data. |
| Release Date: 3/29/2024 |
| Next Release Date: 4/30/2024 |