|
Download Data (XLS File) |
|
||||||||
|
||||||||
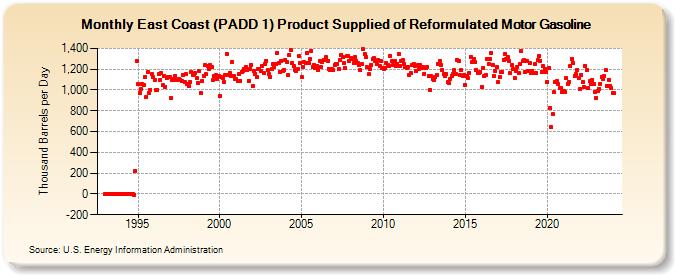
| East Coast (PADD 1) Product Supplied of Reformulated Motor Gasoline (Thousand Barrels per Day) | ||||||||
| Year | Jan | Feb | Mar | Apr | May | Jun | Jul | Aug | Sep | Oct | Nov | Dec |
|---|---|---|---|---|---|---|---|---|---|---|---|---|
| 1993 | 0 | 0 | 0 | 0 | 0 | 0 | 0 | 0 | 0 | 0 | 0 | 0 |
| 1994 | 0 | 0 | 0 | 0 | 0 | 0 | 0 | 0 | 0 | -6 | 222 | 1,281 |
| 1995 | 1,054 | 975 | 1,014 | 1,059 | 1,048 | 1,129 | 934 | 1,169 | 974 | 1,004 | 1,155 | 1,122 |
| 1996 | 1,097 | 996 | 1,000 | 1,154 | 1,097 | 1,159 | 1,046 | 1,136 | 1,031 | 1,114 | 1,129 | 1,128 |
| 1997 | 924 | 1,098 | 1,104 | 1,138 | 1,094 | 1,092 | 1,105 | 1,100 | 1,086 | 1,141 | 1,073 | 1,149 |
| 1998 | 1,056 | 1,035 | 1,076 | 1,176 | 1,140 | 1,149 | 1,165 | 1,114 | 1,068 | 1,179 | 974 | 1,085 |
| 1999 | 1,135 | 1,237 | 1,149 | 1,232 | 1,201 | 1,238 | 1,225 | 1,093 | 1,130 | 1,145 | 1,105 | 1,132 |
| 2000 | 946 | 1,124 | 1,117 | 1,078 | 1,142 | 1,348 | 1,148 | 1,167 | 1,131 | 1,270 | 1,138 | 1,110 |
| 2001 | 1,102 | 1,086 | 1,153 | 1,090 | 1,176 | 1,185 | 1,203 | 1,223 | 1,195 | 1,091 | 1,202 | 1,243 |
| 2002 | 1,034 | 1,186 | 1,157 | 1,127 | 1,197 | 1,205 | 1,181 | 1,234 | 1,165 | 1,252 | 1,280 | 1,191 |
| 2003 | 1,153 | 1,125 | 1,205 | 1,250 | 1,219 | 1,250 | 1,357 | 1,261 | 1,173 | 1,279 | 1,184 | 1,192 |
| 2004 | 1,286 | 1,273 | 1,142 | 1,337 | 1,383 | 1,259 | 1,227 | 1,193 | 1,179 | 1,203 | 1,323 | 1,260 |
| 2005 | 1,123 | 1,225 | 1,265 | 1,260 | 1,357 | 1,257 | 1,300 | 1,379 | 1,224 | 1,238 | 1,208 | 1,232 |
| 2006 | 1,194 | 1,277 | 1,222 | 1,272 | 1,288 | 1,288 | 1,315 | 1,283 | 1,205 | 1,189 | 1,200 | 1,192 |
| 2007 | 1,241 | 1,253 | 1,252 | 1,206 | 1,286 | 1,337 | 1,314 | 1,264 | 1,212 | 1,326 | 1,329 | 1,281 |
| 2008 | 1,311 | 1,301 | 1,260 | 1,315 | 1,283 | 1,257 | 1,245 | 1,188 | 1,247 | 1,391 | 1,346 | 1,321 |
| 2009 | 1,217 | 1,149 | 1,205 | 1,236 | 1,294 | 1,304 | 1,277 | 1,246 | 1,288 | 1,226 | 1,275 | 1,214 |
| 2010 | 1,197 | 1,215 | 1,262 | 1,243 | 1,229 | 1,326 | 1,275 | 1,242 | 1,280 | 1,227 | 1,254 | 1,347 |
| 2011 | 1,234 | 1,277 | 1,287 | 1,248 | 1,221 | 1,215 | 1,225 | 1,148 | 1,162 | 1,243 | 1,248 | 1,234 |
| 2012 | 1,184 | 1,241 | 1,198 | 1,239 | 1,214 | 1,222 | 1,158 | 1,209 | 1,220 | 1,131 | 1,002 | 1,131 |
| 2013 | 1,101 | 1,097 | 1,120 | 1,145 | 1,254 | 1,278 | 1,242 | 1,194 | 1,150 | 1,135 | 1,155 | 1,076 |
| 2014 | 1,064 | 1,109 | 1,138 | 1,153 | 1,189 | 1,153 | 1,291 | 1,278 | 1,140 | 1,193 | 1,131 | 1,141 |
| 2015 | 1,046 | 1,133 | 1,114 | 1,168 | 1,319 | 1,270 | 1,295 | 1,266 | 1,194 | 1,164 | 1,165 | 1,173 |
| 2016 | 1,031 | 1,215 | 1,131 | 1,145 | 1,298 | 1,254 | 1,294 | 1,360 | 1,245 | 1,139 | 1,178 | 1,221 |
| 2017 | 1,072 | 1,129 | 1,170 | 1,170 | 1,289 | 1,349 | 1,299 | 1,318 | 1,276 | 1,160 | 1,238 | 1,197 |
| 2018 | 1,117 | 1,181 | 1,225 | 1,159 | 1,248 | 1,374 | 1,275 | 1,291 | 1,174 | 1,278 | 1,182 | 1,256 |
| 2019 | 1,167 | 1,183 | 1,164 | 1,246 | 1,163 | 1,284 | 1,331 | 1,282 | 1,172 | 1,228 | 1,205 | 1,171 |
| 2020 | 1,080 | 1,209 | 827 | 641 | 766 | 976 | 1,078 | 1,082 | 1,056 | 1,015 | 1,015 | 984 |
| 2021 | 989 | 984 | 1,114 | 1,059 | 1,076 | 1,229 | 1,301 | 1,261 | 1,138 | 1,150 | 1,196 | 1,118 |
| 2022 | 1,014 | 1,142 | 1,075 | 1,030 | 1,233 | 1,192 | 1,019 | 1,082 | 1,053 | 1,096 | 1,057 | 978 |
| 2023 | 922 | 993 | 1,012 | 1,060 | 1,124 | 1,104 | 1,133 | 1,191 | 1,041 | 1,099 | 1,036 | 1,020 |
| 2024 | 970 | |||||||||||
| - = No Data Reported; -- = Not Applicable; NA = Not Available; W = Withheld to avoid disclosure of individual company data. |
| Release Date: 3/29/2024 |
| Next Release Date: 4/30/2024 |