|
Download Data (XLS File) |
|
||||||||
|
||||||||
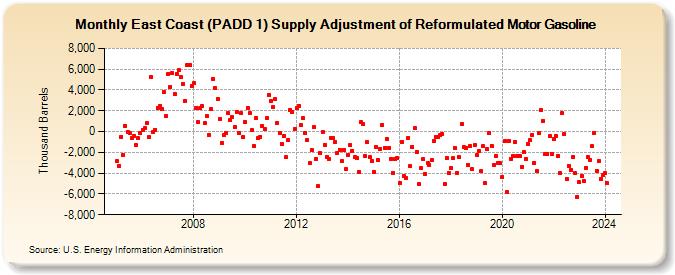
| East Coast (PADD 1) Supply Adjustment of Reformulated Motor Gasoline (Thousand Barrels) | ||||||||
| Year | Jan | Feb | Mar | Apr | May | Jun | Jul | Aug | Sep | Oct | Nov | Dec |
|---|---|---|---|---|---|---|---|---|---|---|---|---|
| 2005 | -2,865 | -3,302 | -497 | -2,237 | 560 | 1 | -137 | -631 | -401 | -1,333 | -663 | -110 |
| 2006 | 159 | 322 | 785 | -562 | 5,235 | -28 | 176 | 2,300 | 2,439 | 2,182 | 3,778 | 1,465 |
| 2007 | 5,546 | 4,312 | 5,639 | 3,591 | 5,530 | 5,917 | 5,205 | 4,594 | 2,918 | 6,389 | 6,380 | 4,416 |
| 2008 | 4,658 | 2,283 | 940 | 2,263 | 2,425 | 803 | 1,467 | -309 | 2,207 | 5,042 | 4,178 | 3,142 |
| 2009 | 1,201 | -1,081 | -340 | -108 | 1,799 | 1,073 | 1,390 | 456 | 1,911 | -175 | 1,754 | -508 |
| 2010 | 916 | 2,271 | 1,786 | 130 | -1,346 | 1,282 | -644 | -479 | 521 | 270 | 1,257 | 3,557 |
| 2011 | 2,924 | 2,362 | 3,103 | 867 | -169 | -1,156 | -446 | -2,485 | -834 | 2,055 | 1,858 | 282 |
| 2012 | 2,268 | 2,486 | 598 | 1,301 | -99 | -782 | -3,009 | -1,768 | 430 | -2,686 | -5,272 | -2,066 |
| 2013 | -67 | -1,251 | -2,440 | -2,624 | -660 | -656 | -989 | -2,094 | -1,744 | -2,855 | -1,748 | -3,635 |
| 2014 | -2,229 | -1,289 | -1,841 | -2,465 | -2,545 | -3,848 | 912 | 732 | -2,360 | -1,017 | -2,483 | -2,831 |
| 2015 | -3,853 | -1,517 | -2,734 | -1,666 | 611 | -1,535 | -682 | -1,576 | -2,618 | -4,005 | -2,671 | -2,572 |
| 2016 | -4,969 | -1,005 | -4,299 | -4,480 | -589 | -3,343 | -1,447 | 305 | -1,935 | -5,085 | -3,538 | -2,647 |
| 2017 | -4,055 | -3,035 | -3,192 | -2,756 | -869 | -487 | -560 | -379 | -223 | -5,006 | -2,542 | -3,994 |
| 2018 | -3,465 | -2,582 | -1,559 | -3,994 | -2,475 | 727 | -1,533 | -1,561 | -3,181 | -1,400 | -3,645 | -1,328 |
| 2019 | -2,253 | -1,877 | -3,823 | -1,434 | -4,974 | -1,703 | -121 | -1,363 | -3,208 | -2,344 | -3,022 | -3,059 |
| 2020 | -4,362 | -956 | -5,858 | -893 | -2,614 | -2,350 | -972 | -2,310 | -2,314 | -3,390 | -2,015 | -2,601 |
| 2021 | -1,234 | -858 | -324 | -3,018 | -3,818 | -156 | 2,061 | 1,050 | -2,152 | -2,166 | -442 | -2,127 |
| 2022 | -764 | -441 | -2,314 | -3,988 | 1,743 | -235 | -4,535 | -3,282 | -3,657 | -2,464 | -4,015 | -6,251 |
| 2023 | -4,854 | -4,262 | -4,766 | -3,475 | -2,492 | -2,707 | -1,432 | -104 | -3,750 | -2,843 | -4,521 | -4,175 |
| 2024 | -4,035 | |||||||||||
| - = No Data Reported; -- = Not Applicable; NA = Not Available; W = Withheld to avoid disclosure of individual company data. |
| Release Date: 3/29/2024 |
| Next Release Date: 4/30/2024 |