|
Download Data (XLS File) |
|
||||||||
|
||||||||
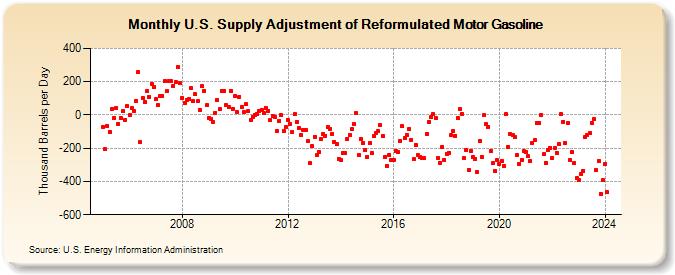
| U.S. Supply Adjustment of Reformulated Motor Gasoline (Thousand Barrels per Day) | ||||||||
| Year | Jan | Feb | Mar | Apr | May | Jun | Jul | Aug | Sep | Oct | Nov | Dec |
|---|---|---|---|---|---|---|---|---|---|---|---|---|
| 2005 | -72 | -207 | -68 | -101 | 37 | -16 | 39 | -53 | -17 | 21 | -30 | 53 |
| 2006 | -1 | 39 | 21 | 86 | 258 | -165 | 102 | 78 | 142 | 109 | 186 | 168 |
| 2007 | 94 | 57 | 113 | 115 | 201 | 141 | 204 | 201 | 176 | 197 | 289 | 191 |
| 2008 | 102 | 73 | 87 | 94 | 161 | 82 | 124 | 83 | 31 | 173 | 146 | 57 |
| 2009 | -16 | -25 | -45 | 12 | 89 | 34 | 144 | 144 | 57 | 50 | 146 | 38 |
| 2010 | 112 | 16 | 110 | 49 | 17 | 64 | 22 | -31 | -11 | -1 | 8 | 25 |
| 2011 | 30 | 9 | 43 | 24 | -32 | -7 | -13 | -96 | -36 | -1 | -96 | -72 |
| 2012 | -32 | -56 | -100 | 4 | -41 | -78 | -118 | -88 | -90 | -159 | -290 | -189 |
| 2013 | -130 | -241 | -222 | -143 | -114 | -125 | -73 | -83 | -112 | -163 | -175 | -263 |
| 2014 | -270 | -226 | -229 | -143 | -121 | -85 | -56 | 12 | -242 | -146 | -166 | -212 |
| 2015 | -250 | -169 | -230 | -127 | -107 | -98 | -63 | -124 | -252 | -305 | -241 | -271 |
| 2016 | -271 | -217 | -224 | -157 | -69 | -136 | -122 | -84 | -148 | -268 | -179 | -243 |
| 2017 | -254 | -257 | -262 | -113 | -41 | -13 | 4 | -16 | -257 | -289 | -191 | -269 |
| 2018 | -234 | -227 | -122 | -97 | -124 | -18 | 33 | 6 | -260 | -213 | -332 | -215 |
| 2019 | -254 | -263 | -343 | -154 | -252 | -3 | -57 | -71 | -219 | -291 | -336 | -273 |
| 2020 | -296 | -275 | -306 | 3 | -190 | -116 | -122 | -133 | -239 | -294 | -270 | -217 |
| 2021 | -221 | -249 | -277 | -168 | -151 | -47 | -47 | 0 | -237 | -288 | -211 | -197 |
| 2022 | -257 | -200 | -228 | -176 | 4 | -41 | -170 | -51 | -270 | -223 | -291 | -378 |
| 2023 | -391 | -356 | -335 | -135 | -118 | -109 | -48 | -24 | -333 | -275 | -473 | -392 |
| 2024 | -295 | |||||||||||
| - = No Data Reported; -- = Not Applicable; NA = Not Available; W = Withheld to avoid disclosure of individual company data. |
| Release Date: 3/29/2024 |
| Next Release Date: 4/30/2024 |
Referring Pages: