|
Download Data (XLS File) |
|
||||||||
|
||||||||
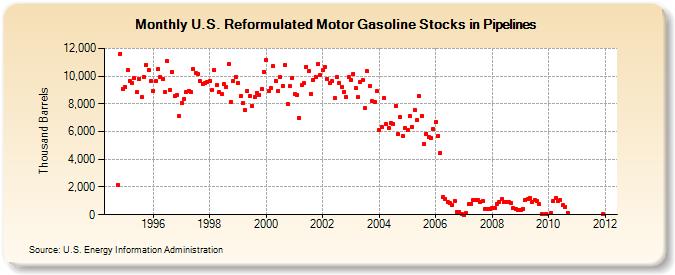
| U.S. Reformulated Motor Gasoline Stocks in Pipelines (Thousand Barrels) | ||||||||
| Year | Jan | Feb | Mar | Apr | May | Jun | Jul | Aug | Sep | Oct | Nov | Dec |
|---|---|---|---|---|---|---|---|---|---|---|---|---|
| 1994 | 2,139 | 11,618 | 9,079 | |||||||||
| 1995 | 9,229 | 10,435 | 9,668 | 9,538 | 9,855 | 8,832 | 9,813 | 8,482 | 9,930 | 10,836 | 10,425 | 9,653 |
| 1996 | 8,918 | 9,620 | 10,479 | 9,932 | 9,803 | 8,858 | 11,084 | 8,990 | 10,329 | 8,553 | 8,655 | 7,102 |
| 1997 | 8,028 | 8,342 | 8,878 | 8,925 | 8,818 | 10,510 | 10,217 | 10,163 | 9,624 | 9,432 | 9,497 | 9,557 |
| 1998 | 9,667 | 8,972 | 10,427 | 9,335 | 8,845 | 8,745 | 9,404 | 9,216 | 10,853 | 8,164 | 9,662 | 9,902 |
| 1999 | 9,534 | 8,551 | 8,066 | 7,568 | 8,936 | 8,578 | 7,853 | 8,517 | 8,817 | 8,665 | 9,041 | 10,322 |
| 2000 | 11,181 | 8,921 | 9,138 | 10,708 | 9,670 | 8,940 | 9,912 | 9,272 | 10,797 | 7,963 | 9,265 | 9,896 |
| 2001 | 8,693 | 8,648 | 6,986 | 9,368 | 9,483 | 10,684 | 10,341 | 8,738 | 9,723 | 9,960 | 10,895 | 10,052 |
| 2002 | 10,424 | 10,648 | 9,808 | 9,470 | 9,623 | 8,418 | 9,926 | 9,496 | 9,221 | 8,883 | 8,499 | 9,904 |
| 2003 | 9,723 | 10,180 | 9,147 | 8,478 | 9,599 | 9,715 | 7,671 | 10,338 | 9,315 | 8,217 | 8,149 | 8,905 |
| 2004 | 6,133 | 6,317 | 8,445 | 6,520 | 6,259 | 6,615 | 6,554 | 7,859 | 5,834 | 7,043 | 5,692 | 6,269 |
| 2005 | 6,102 | 7,104 | 6,334 | 7,562 | 6,812 | 8,540 | 7,125 | 5,117 | 5,826 | 5,587 | 5,567 | 6,177 |
| 2006 | 6,721 | 5,698 | 4,469 | 1,270 | 1,149 | 886 | 864 | 714 | 1,015 | 213 | 226 | 35 |
| 2007 | 8 | 120 | 745 | 802 | 1,044 | 1,071 | 1,050 | 924 | 968 | 411 | 386 | 414 |
| 2008 | 496 | 488 | 801 | 904 | 1,133 | 887 | 897 | 894 | 851 | 469 | 412 | 374 |
| 2009 | 369 | 444 | 1,037 | 1,115 | 1,221 | 917 | 1,063 | 980 | 743 | 34 | 19 | |
| 2010 | 116 | 960 | 1,189 | 963 | 1,055 | 697 | 591 | 132 | ||||
| 2011 | 27 | |||||||||||
| - = No Data Reported; -- = Not Applicable; NA = Not Available; W = Withheld to avoid disclosure of individual company data. |
| Release Date: 3/29/2024 |
| Next Release Date: 4/30/2024 |