|
Download Data (XLS File) |
|
||||||||
|
||||||||
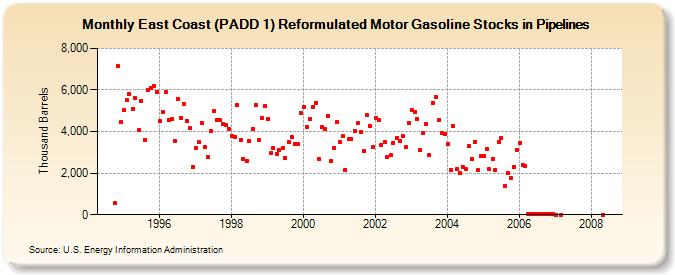
| East Coast (PADD 1) Reformulated Motor Gasoline Stocks in Pipelines (Thousand Barrels) | ||||||||
| Year | Jan | Feb | Mar | Apr | May | Jun | Jul | Aug | Sep | Oct | Nov | Dec |
|---|---|---|---|---|---|---|---|---|---|---|---|---|
| 1994 | 559 | 7,133 | 4,447 | |||||||||
| 1995 | 5,024 | 5,514 | 5,829 | 5,085 | 5,613 | 4,053 | 5,475 | 3,591 | 6,002 | 6,085 | 6,184 | 5,903 |
| 1996 | 4,507 | 4,919 | 5,894 | 4,539 | 4,580 | 3,563 | 5,582 | 4,675 | 5,333 | 4,528 | 4,153 | 2,315 |
| 1997 | 3,209 | 3,474 | 4,429 | 3,253 | 2,774 | 4,036 | 4,989 | 4,544 | 4,573 | 4,351 | 4,335 | 4,139 |
| 1998 | 3,793 | 3,717 | 5,256 | 3,600 | 2,672 | 2,587 | 3,523 | 4,146 | 5,267 | 3,576 | 4,658 | 5,211 |
| 1999 | 4,588 | 2,950 | 3,225 | 2,935 | 3,106 | 3,200 | 2,723 | 3,485 | 3,750 | 3,378 | 3,417 | 4,888 |
| 2000 | 5,159 | 4,236 | 4,598 | 5,178 | 5,386 | 2,697 | 4,228 | 4,137 | 4,760 | 2,581 | 3,190 | 4,457 |
| 2001 | 3,483 | 3,768 | 2,169 | 3,623 | 3,640 | 4,036 | 4,412 | 3,966 | 3,059 | 4,779 | 4,289 | 3,244 |
| 2002 | 4,662 | 4,540 | 3,361 | 3,491 | 2,786 | 2,853 | 3,472 | 3,712 | 3,526 | 3,775 | 3,269 | 4,417 |
| 2003 | 5,033 | 4,963 | 4,614 | 3,123 | 3,928 | 4,359 | 2,884 | 5,382 | 5,668 | 4,552 | 3,936 | 3,882 |
| 2004 | 3,403 | 2,165 | 4,250 | 2,188 | 2,003 | 2,308 | 2,184 | 3,314 | 2,680 | 3,514 | 2,131 | 2,804 |
| 2005 | 2,835 | 3,152 | 2,183 | 2,677 | 2,132 | 3,491 | 3,707 | 1,389 | 1,988 | 1,761 | 2,309 | 3,113 |
| 2006 | 3,440 | 2,376 | 2,364 | 37 | 26 | 16 | 29 | 16 | 16 | 16 | 16 | 35 |
| 2007 | 8 | 9 | ||||||||||
| 2008 | 2 | |||||||||||
| - = No Data Reported; -- = Not Applicable; NA = Not Available; W = Withheld to avoid disclosure of individual company data. |
| Release Date: 3/29/2024 |
| Next Release Date: 4/30/2024 |