|
Download Data (XLS File) |
|
||||||||
|
||||||||
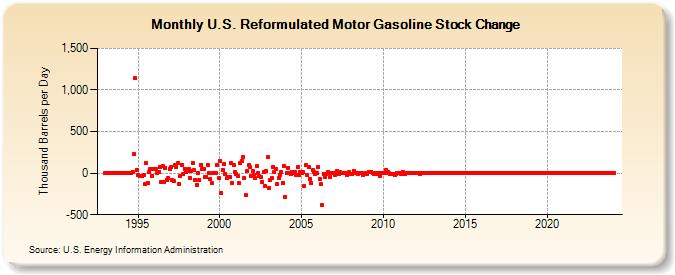
| U.S. Reformulated Motor Gasoline Stock Change (Thousand Barrels per Day) | ||||||||
| Year | Jan | Feb | Mar | Apr | May | Jun | Jul | Aug | Sep | Oct | Nov | Dec |
|---|---|---|---|---|---|---|---|---|---|---|---|---|
| 1993 | 0 | 0 | 0 | 0 | 0 | 0 | 0 | 0 | 0 | 0 | 0 | 0 |
| 1994 | 0 | 0 | 0 | 0 | 0 | 0 | 0 | 0 | 12 | 231 | 1,143 | 43 |
| 1995 | -28 | -31 | -34 | -34 | -24 | -135 | 116 | -122 | 16 | 44 | -30 | 49 |
| 1996 | 50 | 53 | -3 | 12 | 79 | -109 | 81 | -107 | 67 | -83 | -61 | 55 |
| 1997 | 69 | -87 | -98 | 92 | 77 | 116 | -125 | -34 | 103 | -14 | 53 | 16 |
| 1998 | 22 | 50 | -58 | 24 | 122 | 37 | -82 | -139 | 5 | -80 | 103 | 51 |
| 1999 | 52 | -52 | -42 | 99 | 3 | -76 | -119 | -3 | 7 | 0 | 101 | -64 |
| 2000 | 148 | -240 | 41 | 113 | -8 | -59 | -43 | -47 | 118 | -121 | 98 | 8 |
| 2001 | -10 | -39 | -121 | 117 | 149 | 189 | -63 | -266 | 21 | 94 | 72 | -36 |
| 2002 | 21 | -17 | -60 | 83 | 5 | -34 | -46 | -106 | 13 | -160 | 21 | 190 |
| 2003 | -174 | -79 | -63 | 78 | 14 | 55 | -130 | -58 | -25 | 12 | -118 | 88 |
| 2004 | -285 | 7 | 64 | -4 | -13 | 11 | 2 | 9 | -27 | 79 | -25 | 12 |
| 2005 | -3 | 12 | -153 | 94 | -26 | 77 | -65 | -121 | 34 | 11 | -12 | 7 |
| 2006 | 79 | -70 | -135 | -387 | -5 | -46 | -11 | 8 | -4 | -44 | 1 | -2 |
| 2007 | -18 | -2 | 31 | -6 | 9 | 0 | -2 | -4 | -4 | -20 | -7 | 9 |
| 2008 | -7 | -9 | 29 | 7 | 2 | -5 | 0 | 2 | -1 | -21 | -15 | 4 |
| 2009 | -6 | 17 | 15 | 15 | 7 | -12 | -3 | -9 | 0 | -35 | -3 | 1 |
| 2010 | 1 | 5 | 37 | 14 | -2 | -9 | -7 | -10 | -21 | -12 | -1 | 2 |
| 2011 | 4 | -6 | 17 | -15 | -8 | 1 | 0 | 2 | 0 | -2 | 2 | 1 |
| 2012 | 2 | 0 | 0 | -8 | 0 | 0 | 0 | 1 | 0 | 0 | 0 | 1 |
| 2013 | 0 | 0 | 0 | 0 | 0 | -1 | 0 | 0 | 0 | 0 | 0 | 0 |
| 2014 | 0 | 0 | 0 | 0 | 0 | 0 | 0 | 0 | 0 | 0 | 0 | 0 |
| 2015 | 0 | 0 | 0 | 0 | 0 | 1 | 0 | 0 | 0 | 0 | 0 | -1 |
| 2016 | 0 | 0 | 0 | 0 | 1 | 0 | 0 | 0 | 0 | 0 | 0 | 0 |
| 2017 | 0 | 0 | 0 | 0 | 0 | 0 | 0 | 0 | 0 | 0 | 0 | 0 |
| 2018 | 0 | 0 | 0 | 0 | 0 | 1 | 0 | 0 | 0 | 0 | 0 | 0 |
| 2019 | 0 | -1 | 0 | 0 | 0 | 0 | 0 | 0 | 0 | 0 | 0 | 0 |
| 2020 | 0 | 0 | 0 | 0 | 0 | 0 | 0 | 0 | 0 | 0 | 0 | 0 |
| 2021 | 0 | 0 | -1 | 0 | 0 | 0 | 0 | 0 | 0 | 0 | 0 | 0 |
| 2022 | 0 | 0 | 0 | 0 | 0 | 0 | 0 | 0 | 0 | 0 | 0 | 0 |
| 2023 | 0 | 0 | 0 | 0 | 0 | 0 | 0 | 0 | 0 | 0 | 0 | 0 |
| 2024 | 0 | |||||||||||
| - = No Data Reported; -- = Not Applicable; NA = Not Available; W = Withheld to avoid disclosure of individual company data. |
| Release Date: 3/29/2024 |
| Next Release Date: 4/30/2024 |
Referring Pages: