|
Download Data (XLS File) |
|
||||||||
|
||||||||
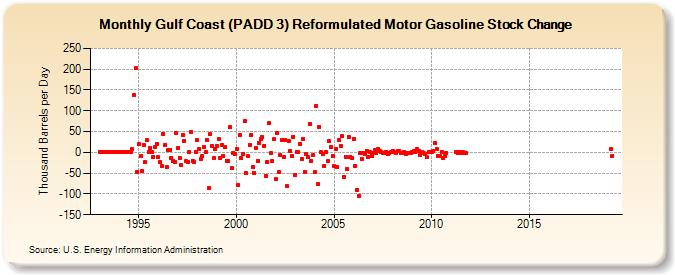
| Gulf Coast (PADD 3) Reformulated Motor Gasoline Stock Change (Thousand Barrels per Day) | ||||||||
| Year | Jan | Feb | Mar | Apr | May | Jun | Jul | Aug | Sep | Oct | Nov | Dec |
|---|---|---|---|---|---|---|---|---|---|---|---|---|
| 1993 | 0 | 0 | 0 | 0 | 0 | 0 | 0 | 0 | 0 | 0 | 0 | 0 |
| 1994 | 0 | 0 | 0 | 0 | 0 | 0 | 0 | 0 | 7 | 138 | 202 | -48 |
| 1995 | 20 | -9 | -44 | 17 | -24 | 29 | 2 | 10 | 1 | -10 | 14 | 21 |
| 1996 | -12 | -23 | -32 | 44 | 18 | -35 | 5 | 6 | -13 | -22 | -24 | 46 |
| 1997 | 11 | -13 | -31 | 42 | 28 | -22 | -23 | 1 | 50 | -20 | -23 | 1 |
| 1998 | 29 | 8 | -16 | -9 | 14 | 0 | 30 | -86 | 43 | 16 | -14 | 7 |
| 1999 | 15 | 31 | -13 | 18 | -8 | 13 | -20 | -21 | 60 | -38 | -1 | -3 |
| 2000 | 9 | -79 | 42 | -14 | -3 | 75 | -50 | -9 | 18 | 42 | -35 | -50 |
| 2001 | 10 | -20 | 22 | 33 | 37 | 16 | -56 | -23 | 70 | -2 | -22 | 31 |
| 2002 | -65 | 47 | -47 | -6 | 29 | -12 | 30 | -81 | 28 | 4 | -8 | 38 |
| 2003 | -54 | 2 | 1 | 21 | -15 | 32 | -47 | -5 | -12 | 69 | -21 | -6 |
| 2004 | -48 | 112 | -75 | 61 | 0 | -5 | -33 | 1 | -22 | 27 | 13 | -8 |
| 2005 | -33 | 7 | -35 | 29 | 16 | 39 | -59 | -10 | -40 | 36 | -10 | -14 |
| 2006 | 33 | -32 | -90 | -106 | -2 | -15 | -2 | -3 | 4 | -10 | 1 | -8 |
| 2007 | -1 | 5 | -1 | 9 | 4 | 1 | -2 | -1 | 1 | -5 | -1 | 1 |
| 2008 | 3 | 0 | -1 | 3 | 3 | -1 | -1 | 2 | -3 | -2 | -1 | -1 |
| 2009 | 0 | 3 | 1 | 8 | 4 | -7 | 1 | -1 | -4 | -12 | 0 | 0 |
| 2010 | 0 | 4 | 23 | 7 | -8 | -9 | 1 | -13 | -8 | -1 | ||
| 2011 | 2 | -1 | 2 | -1 | 2 | -1 | -2 | |||||
| 2012 | 2 | 1 | 0 | 1 | -1 | -2 | -1 | |||||
| 2019 | 8 | -8 | ||||||||||
| - = No Data Reported; -- = Not Applicable; NA = Not Available; W = Withheld to avoid disclosure of individual company data. |
| Release Date: 3/29/2024 |
| Next Release Date: 4/30/2024 |