|
Download Data (XLS File) |
|
||||||||
|
||||||||
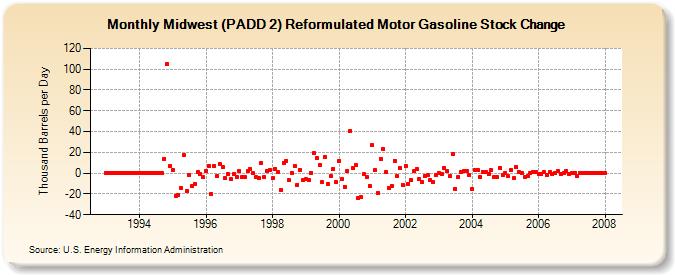
| Midwest (PADD 2) Reformulated Motor Gasoline Stock Change (Thousand Barrels per Day) | ||||||||
| Year | Jan | Feb | Mar | Apr | May | Jun | Jul | Aug | Sep | Oct | Nov | Dec |
|---|---|---|---|---|---|---|---|---|---|---|---|---|
| 1993 | 0 | 0 | 0 | 0 | 0 | 0 | 0 | 0 | 0 | 0 | 0 | 0 |
| 1994 | 0 | 0 | 0 | 0 | 0 | 0 | 0 | 0 | 0 | 14 | 105 | 7 |
| 1995 | 3 | -22 | -21 | -14 | 17 | -17 | -2 | -12 | -10 | 1 | -1 | -4 |
| 1996 | 2 | 7 | -20 | 7 | -3 | 9 | 6 | -5 | -1 | -6 | -1 | -4 |
| 1997 | 2 | -4 | -4 | 2 | 4 | 0 | -4 | -5 | 10 | -4 | 2 | 3 |
| 1998 | -5 | 4 | 1 | -16 | 10 | 12 | -7 | 0 | 7 | -11 | 3 | -7 |
| 1999 | -6 | -7 | 0 | 19 | 15 | 8 | -9 | 16 | -10 | -3 | 4 | -9 |
| 2000 | 12 | -6 | -13 | 2 | 41 | 5 | 8 | -24 | -23 | -1 | -4 | -12 |
| 2001 | 27 | 3 | -19 | 14 | 23 | 1 | -14 | -12 | 12 | -3 | 5 | -11 |
| 2002 | 7 | -10 | -7 | 2 | 4 | -6 | -9 | -3 | -2 | -7 | -9 | -2 |
| 2003 | 0 | -1 | 5 | 2 | -3 | 18 | -15 | -4 | 1 | 2 | 2 | -2 |
| 2004 | -15 | 3 | 3 | -4 | 1 | 1 | -1 | 3 | -4 | -4 | 5 | -2 |
| 2005 | 0 | -3 | 3 | -5 | 6 | 1 | 0 | -4 | -3 | 0 | 1 | 1 |
| 2006 | -1 | -1 | 1 | -2 | 1 | -1 | 0 | 2 | -1 | 0 | 2 | -1 |
| 2007 | 0 | 0 | -3 | 0 | 0 | 0 | 0 | 0 | 0 | 0 | 0 | 0 |
| 2008 | 0 | |||||||||||
| - = No Data Reported; -- = Not Applicable; NA = Not Available; W = Withheld to avoid disclosure of individual company data. |
| Release Date: 8/30/2024 |
| Next Release Date: 9/30/2024 |