|
Download Data (XLS File) |
|
||||||||
|
||||||||
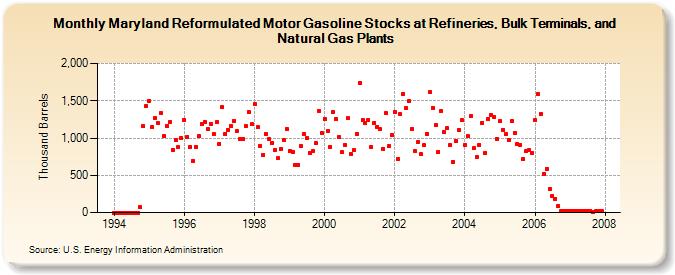
| Maryland Reformulated Motor Gasoline Stocks at Refineries, Bulk Terminals, and Natural Gas Plants (Thousand Barrels) | ||||||||
| Year | Jan | Feb | Mar | Apr | May | Jun | Jul | Aug | Sep | Oct | Nov | Dec |
|---|---|---|---|---|---|---|---|---|---|---|---|---|
| 1994 | 0 | 0 | 0 | 0 | 0 | 0 | 0 | 0 | 0 | 71 | 1,161 | 1,429 |
| 1995 | 1,501 | 1,149 | 1,275 | 1,196 | 1,337 | 1,027 | 1,163 | 1,213 | 845 | 971 | 873 | 1,003 |
| 1996 | 1,243 | 1,016 | 881 | 698 | 883 | 1,022 | 1,191 | 1,217 | 1,123 | 1,189 | 1,054 | 1,214 |
| 1997 | 926 | 1,415 | 1,060 | 1,108 | 1,164 | 1,235 | 1,094 | 986 | 991 | 1,156 | 1,352 | 1,182 |
| 1998 | 1,450 | 1,144 | 893 | 778 | 1,055 | 990 | 934 | 836 | 727 | 857 | 967 | 1,127 |
| 1999 | 825 | 817 | 633 | 644 | 887 | 1,054 | 1,000 | 800 | 820 | 932 | 1,367 | 1,062 |
| 2000 | 1,259 | 1,096 | 884 | 1,344 | 1,253 | 1,010 | 807 | 908 | 1,264 | 783 | 839 | 1,056 |
| 2001 | 1,735 | 1,241 | 1,204 | 1,240 | 884 | 1,202 | 1,154 | 1,115 | 859 | 1,331 | 887 | 1,039 |
| 2002 | 1,344 | 725 | 1,320 | 1,597 | 1,399 | 1,494 | 1,125 | 823 | 953 | 781 | 901 | 1,060 |
| 2003 | 1,611 | 1,404 | 1,172 | 819 | 1,360 | 1,080 | 1,130 | 903 | 682 | 961 | 1,110 | 1,237 |
| 2004 | 911 | 1,021 | 1,294 | 865 | 746 | 908 | 1,205 | 798 | 1,258 | 1,310 | 1,279 | 993 |
| 2005 | 1,225 | 1,113 | 1,053 | 972 | 1,227 | 1,072 | 920 | 907 | 720 | 822 | 839 | 803 |
| 2006 | 1,241 | 1,590 | 1,320 | 523 | 588 | 319 | 228 | 182 | 85 | 24 | 27 | 26 |
| 2007 | 21 | 24 | 18 | 16 | 18 | 17 | 17 | 25 | 14 | 17 | 15 | 17 |
| - = No Data Reported; -- = Not Applicable; NA = Not Available; W = Withheld to avoid disclosure of individual company data. |
| Release Date: 3/29/2024 |
| Next Release Date: 4/30/2024 |