|
Download Data (XLS File) |
|
||||||||
|
||||||||
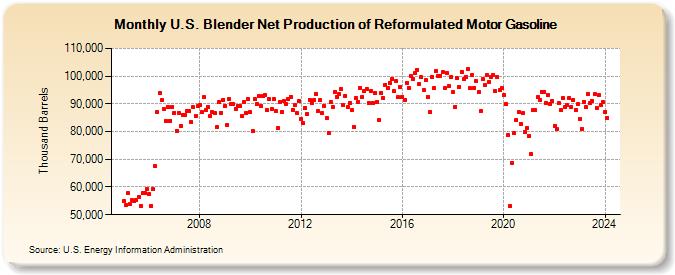
| U.S. Blender Net Production of Reformulated Motor Gasoline (Thousand Barrels) | ||||||||
| Year | Jan | Feb | Mar | Apr | May | Jun | Jul | Aug | Sep | Oct | Nov | Dec |
|---|---|---|---|---|---|---|---|---|---|---|---|---|
| 2005 | 54,812 | 53,484 | 57,823 | 53,759 | 55,203 | 54,894 | 55,128 | 56,396 | 53,310 | 57,744 | 57,676 | 59,291 |
| 2006 | 57,475 | 53,173 | 59,179 | 67,439 | 86,991 | 93,967 | 91,300 | 88,299 | 83,822 | 88,701 | 83,934 | 88,971 |
| 2007 | 86,718 | 80,264 | 86,738 | 81,987 | 86,139 | 85,998 | 87,264 | 87,311 | 83,399 | 88,896 | 85,650 | 89,075 |
| 2008 | 89,638 | 86,984 | 92,311 | 87,621 | 88,933 | 85,649 | 86,926 | 86,842 | 81,577 | 90,558 | 86,832 | 91,538 |
| 2009 | 89,310 | 82,422 | 91,742 | 89,878 | 89,905 | 88,284 | 89,235 | 89,077 | 85,580 | 90,750 | 86,721 | 91,727 |
| 2010 | 86,924 | 80,268 | 91,816 | 89,806 | 92,744 | 89,366 | 92,990 | 93,215 | 87,766 | 91,647 | 88,208 | 91,708 |
| 2011 | 87,273 | 81,281 | 90,767 | 87,217 | 90,963 | 89,970 | 91,754 | 92,593 | 87,797 | 89,466 | 86,603 | 90,964 |
| 2012 | 84,584 | 82,941 | 88,636 | 86,427 | 91,397 | 90,176 | 91,261 | 93,603 | 87,490 | 91,228 | 86,620 | 89,177 |
| 2013 | 84,939 | 79,571 | 90,514 | 88,988 | 94,295 | 92,621 | 93,564 | 95,355 | 89,401 | 92,976 | 88,861 | 90,366 |
| 2014 | 87,701 | 81,746 | 92,129 | 90,722 | 95,839 | 92,594 | 94,478 | 95,500 | 90,343 | 94,541 | 90,365 | 93,975 |
| 2015 | 90,716 | 84,085 | 94,010 | 92,029 | 96,897 | 95,704 | 97,660 | 98,931 | 94,466 | 98,222 | 92,372 | 96,104 |
| 2016 | 92,514 | 91,317 | 97,576 | 95,873 | 100,045 | 98,914 | 101,072 | 102,371 | 97,331 | 99,499 | 95,034 | 98,502 |
| 2017 | 92,635 | 87,155 | 99,812 | 95,734 | 101,671 | 99,927 | 100,181 | 101,474 | 95,546 | 101,238 | 96,353 | 99,706 |
| 2018 | 94,160 | 88,988 | 99,149 | 96,169 | 101,657 | 98,892 | 99,704 | 102,519 | 95,576 | 100,334 | 95,835 | 98,235 |
| 2019 | 94,137 | 87,348 | 98,860 | 96,729 | 100,359 | 97,854 | 99,764 | 100,423 | 94,581 | 99,588 | 94,871 | 95,621 |
| 2020 | 93,047 | 89,786 | 78,771 | 53,130 | 68,787 | 79,353 | 84,191 | 87,021 | 82,853 | 86,600 | 79,961 | 81,408 |
| 2021 | 78,430 | 71,890 | 87,674 | 87,698 | 92,383 | 91,394 | 94,428 | 94,442 | 90,218 | 93,213 | 89,868 | 90,922 |
| 2022 | 82,124 | 80,741 | 90,120 | 87,830 | 92,104 | 88,961 | 89,462 | 92,109 | 88,877 | 91,498 | 87,875 | 89,760 |
| 2023 | 84,632 | 80,939 | 90,693 | 88,869 | 93,514 | 90,231 | 91,053 | 93,491 | 88,672 | 93,050 | 89,641 | 90,547 |
| 2024 | 87,160 | |||||||||||
| - = No Data Reported; -- = Not Applicable; NA = Not Available; W = Withheld to avoid disclosure of individual company data. |
| Release Date: 3/29/2024 |
| Next Release Date: 4/30/2024 |