|
Download Data (XLS File) |
|
||||||||
|
||||||||
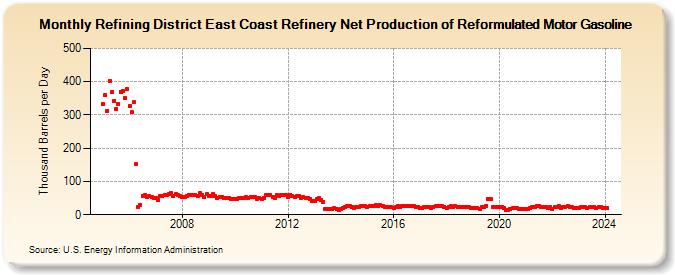
| Refining District East Coast Refinery Net Production of Reformulated Motor Gasoline (Thousand Barrels per Day) | ||||||||
| Year | Jan | Feb | Mar | Apr | May | Jun | Jul | Aug | Sep | Oct | Nov | Dec |
|---|---|---|---|---|---|---|---|---|---|---|---|---|
| 2005 | 333 | 359 | 313 | 403 | 368 | 343 | 319 | 333 | 370 | 371 | 350 | 377 |
| 2006 | 327 | 308 | 338 | 151 | 24 | 29 | 57 | 59 | 52 | 56 | 52 | 51 |
| 2007 | 49 | 45 | 56 | 55 | 59 | 58 | 62 | 66 | 56 | 61 | 60 | 57 |
| 2008 | 52 | 53 | 56 | 60 | 58 | 59 | 59 | 57 | 66 | 60 | 52 | 61 |
| 2009 | 55 | 56 | 61 | 55 | 50 | 54 | 54 | 50 | 51 | 50 | 47 | 48 |
| 2010 | 48 | 47 | 51 | 50 | 51 | 52 | 51 | 53 | 52 | 52 | 48 | 51 |
| 2011 | 46 | 49 | 58 | 58 | 59 | 54 | 51 | 59 | 56 | 58 | 59 | 59 |
| 2012 | 52 | 60 | 55 | 53 | 55 | 56 | 51 | 53 | 50 | 49 | 48 | 41 |
| 2013 | 42 | 47 | 49 | 44 | 39 | 17 | 17 | 16 | 16 | 20 | 16 | 14 |
| 2014 | 18 | 19 | 23 | 26 | 25 | 23 | 21 | 22 | 23 | 25 | 26 | 25 |
| 2015 | 23 | 25 | 27 | 25 | 28 | 26 | 28 | 25 | 23 | 24 | 22 | 22 |
| 2016 | 21 | 22 | 27 | 24 | 25 | 27 | 25 | 25 | 25 | 25 | 24 | 24 |
| 2017 | 19 | 20 | 23 | 22 | 22 | 21 | 24 | 25 | 25 | 25 | 25 | 24 |
| 2018 | 21 | 22 | 26 | 23 | 26 | 23 | 23 | 22 | 23 | 24 | 22 | 21 |
| 2019 | 21 | 19 | 19 | 18 | 22 | 23 | 27 | 46 | 47 | 23 | 23 | 23 |
| 2020 | 22 | 22 | 19 | 13 | 15 | 18 | 19 | 20 | 19 | 18 | 17 | 17 |
| 2021 | 16 | 16 | 20 | 23 | 24 | 25 | 25 | 23 | 22 | 23 | 21 | 23 |
| 2022 | 18 | 22 | 22 | 26 | 20 | 23 | 24 | 25 | 24 | 22 | 21 | 21 |
| 2023 | 20 | 22 | 22 | 22 | 21 | 22 | 22 | 22 | 21 | 22 | 22 | 21 |
| 2024 | 20 | 20 | ||||||||||
| - = No Data Reported; -- = Not Applicable; NA = Not Available; W = Withheld to avoid disclosure of individual company data. |
| Release Date: 4/30/2024 |
| Next Release Date: 5/31/2024 |