|
Download Data (XLS File) |
|
||||||||
|
||||||||
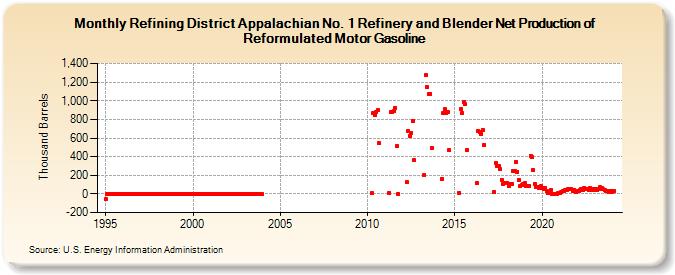
| Refining District Appalachian No. 1 Refinery and Blender Net Production of Reformulated Motor Gasoline (Thousand Barrels) | ||||||||
| Year | Jan | Feb | Mar | Apr | May | Jun | Jul | Aug | Sep | Oct | Nov | Dec |
|---|---|---|---|---|---|---|---|---|---|---|---|---|
| 1995 | -54 | 0 | 0 | 0 | 0 | 0 | 0 | 0 | 0 | 0 | 0 | 0 |
| 1996 | 0 | 0 | 0 | 0 | 0 | 0 | 0 | 0 | 0 | 0 | 0 | 0 |
| 1997 | 0 | 0 | 0 | 0 | 0 | 0 | 0 | 0 | 0 | 0 | 0 | 0 |
| 1998 | 0 | 0 | 0 | 0 | 0 | 0 | 0 | 0 | 0 | 0 | 0 | 0 |
| 1999 | 0 | 0 | 0 | 0 | 0 | 0 | 0 | 0 | 0 | 0 | 0 | 0 |
| 2000 | 0 | 0 | 0 | 0 | 0 | 0 | 0 | 0 | 0 | 0 | 0 | 0 |
| 2001 | 0 | 0 | 0 | 0 | 0 | 0 | 0 | 0 | 0 | 0 | 0 | 0 |
| 2002 | 0 | 0 | 0 | 0 | 0 | 0 | 0 | 0 | 0 | 0 | 0 | 0 |
| 2003 | 0 | 0 | 0 | 0 | 0 | 0 | 0 | 0 | 0 | 0 | 0 | 0 |
| 2010 | 7 | 866 | 849 | 883 | 899 | 542 | ||||||
| 2011 | 10 | 878 | 874 | 887 | 927 | 511 | 1 | |||||
| 2012 | 124 | 675 | 627 | 656 | 785 | 362 | ||||||
| 2013 | 202 | 1,275 | 1,147 | 1,071 | 1,073 | 495 | ||||||
| 2014 | 165 | 864 | 908 | 871 | 883 | 467 | ||||||
| 2015 | 14 | 907 | 869 | 982 | 962 | 467 | ||||||
| 2016 | 113 | 678 | 665 | 648 | 691 | 527 | ||||||
| 2017 | 22 | 328 | 300 | 296 | 263 | 153 | 104 | 112 | 119 | |||
| 2018 | 120 | 83 | 106 | 105 | 250 | 242 | 348 | 240 | 151 | 90 | 97 | 108 |
| 2019 | 114 | 90 | 80 | 88 | 411 | 391 | 253 | 111 | 70 | 79 | 66 | 82 |
| 2020 | 64 | 48 | 64 | 28 | 12 | 16 | 41 | 2 | 2 | 3 | 1 | 6 |
| 2021 | 12 | 21 | 28 | 28 | 39 | 46 | 48 | 48 | 56 | 34 | 46 | 26 |
| 2022 | 27 | 30 | 42 | 51 | 39 | 68 | 50 | 49 | 47 | 67 | 40 | 54 |
| 2023 | 44 | 49 | 42 | 54 | 69 | 67 | 50 | 38 | 33 | 27 | 24 | 27 |
| 2024 | 21 | |||||||||||
| - = No Data Reported; -- = Not Applicable; NA = Not Available; W = Withheld to avoid disclosure of individual company data. |
| Release Date: 3/29/2024 |
| Next Release Date: 4/30/2024 |