|
Download Data (XLS File) |
|
||||||||
|
||||||||
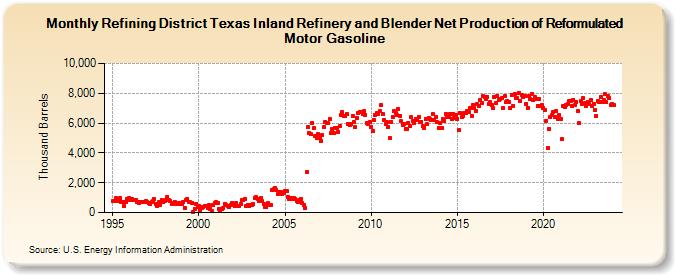
| Refining District Texas Inland Refinery and Blender Net Production of Reformulated Motor Gasoline (Thousand Barrels) | ||||||||
| Year | Jan | Feb | Mar | Apr | May | Jun | Jul | Aug | Sep | Oct | Nov | Dec |
|---|---|---|---|---|---|---|---|---|---|---|---|---|
| 1995 | 752 | 769 | 944 | 803 | 924 | 952 | 688 | 722 | 451 | 717 | 917 | 963 |
| 1996 | 822 | 917 | 820 | 809 | 827 | 692 | 631 | 721 | 683 | 711 | 725 | 772 |
| 1997 | 699 | 670 | 587 | 684 | 781 | 900 | 553 | 437 | 677 | 497 | 846 | 688 |
| 1998 | 747 | 824 | 1,070 | 828 | 806 | 592 | 672 | 714 | 567 | 566 | 641 | 582 |
| 1999 | 556 | 685 | 337 | 836 | 915 | 688 | 685 | 666 | 71 | 258 | 606 | 401 |
| 2000 | 435 | 178 | 330 | 344 | 422 | 428 | 299 | 481 | 239 | 125 | 517 | 617 |
| 2001 | 685 | 637 | 243 | 198 | 236 | 334 | 570 | 494 | 426 | 364 | 538 | 628 |
| 2002 | 576 | 470 | 656 | 414 | 449 | 543 | 874 | 868 | 899 | 447 | 520 | 441 |
| 2003 | 515 | 513 | 557 | 989 | 1,025 | 933 | 785 | 984 | 756 | 592 | 397 | 345 |
| 2004 | 615 | 530 | 489 | 1,507 | 1,563 | 1,645 | 1,492 | 1,238 | 1,355 | 1,393 | 1,271 | 1,334 |
| 2005 | 1,413 | 1,439 | 1,063 | 928 | 998 | 916 | 951 | 891 | 762 | 714 | 837 | 942 |
| 2006 | 669 | 533 | 338 | 2,727 | 5,759 | 5,316 | 5,252 | 6,021 | 5,669 | 5,123 | 4,970 | 5,270 |
| 2007 | 4,978 | 4,820 | 5,187 | 5,738 | 6,082 | 6,023 | 5,975 | 6,246 | 5,318 | 5,574 | 5,349 | 5,639 |
| 2008 | 5,653 | 5,434 | 5,783 | 6,515 | 6,739 | 6,472 | 6,448 | 6,580 | 5,945 | 5,897 | 5,946 | 6,464 |
| 2009 | 6,104 | 5,722 | 6,315 | 6,703 | 6,749 | 6,729 | 6,604 | 6,779 | 6,563 | 5,997 | 5,914 | 6,052 |
| 2010 | 5,766 | 5,446 | 6,223 | 6,569 | 6,689 | 6,584 | 6,812 | 7,197 | 6,597 | 6,223 | 5,945 | 6,059 |
| 2011 | 5,771 | 5,007 | 6,092 | 6,432 | 6,810 | 6,692 | 6,511 | 6,962 | 6,502 | 6,120 | 5,903 | 5,944 |
| 2012 | 5,638 | 5,592 | 6,020 | 5,838 | 6,386 | 6,168 | 6,030 | 6,306 | 6,186 | 6,408 | 6,082 | 6,108 |
| 2013 | 5,777 | 5,693 | 6,301 | 5,914 | 6,326 | 6,261 | 6,202 | 6,583 | 6,236 | 6,437 | 6,057 | 5,687 |
| 2014 | 6,001 | 5,647 | 6,263 | 6,162 | 6,614 | 6,396 | 6,434 | 6,624 | 6,269 | 6,632 | 6,325 | 6,564 |
| 2015 | 6,294 | 5,534 | 6,665 | 6,384 | 6,510 | 6,655 | 6,664 | 6,834 | 6,730 | 7,005 | 6,463 | 7,242 |
| 2016 | 6,981 | 6,841 | 7,257 | 7,115 | 7,564 | 7,328 | 7,786 | 7,779 | 7,615 | 7,784 | 7,306 | 7,398 |
| 2017 | 7,200 | 6,982 | 7,743 | 7,362 | 7,823 | 7,520 | 7,641 | 7,659 | 6,988 | 7,791 | 7,388 | 7,499 |
| 2018 | 7,421 | 6,995 | 7,900 | 7,172 | 7,977 | 7,706 | 7,654 | 8,007 | 7,470 | 7,907 | 7,757 | 7,804 |
| 2019 | 7,313 | 7,036 | 7,806 | 7,633 | 7,982 | 7,571 | 7,736 | 7,627 | 7,163 | 7,648 | 7,178 | 7,192 |
| 2020 | 7,008 | 6,863 | 6,159 | 4,324 | 5,633 | 6,387 | 6,515 | 6,717 | 6,402 | 6,805 | 6,302 | 6,524 |
| 2021 | 6,251 | 4,934 | 7,138 | 7,050 | 7,190 | 7,285 | 7,466 | 7,474 | 7,151 | 7,567 | 7,223 | 7,402 |
| 2022 | 6,809 | 5,982 | 7,454 | 7,287 | 7,668 | 7,331 | 7,140 | 7,442 | 7,315 | 7,543 | 7,179 | 7,308 |
| 2023 | 6,868 | 6,487 | 7,514 | 7,424 | 7,767 | 7,392 | 7,530 | 7,921 | 7,373 | 7,808 | 7,678 | 7,244 |
| 2024 | 7,266 | 7,201 | 7,949 | 7,671 | 8,082 | 7,726 | ||||||
| - = No Data Reported; -- = Not Applicable; NA = Not Available; W = Withheld to avoid disclosure of individual company data. |
| Release Date: 8/30/2024 |
| Next Release Date: 9/30/2024 |