|
Download Data (XLS File) |
|
||||||||
|
||||||||
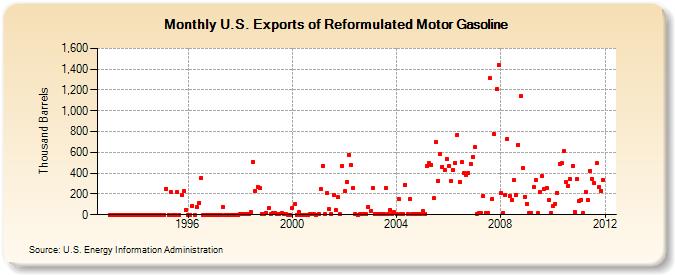
| U.S. Exports of Reformulated Motor Gasoline (Thousand Barrels) | ||||||||
| Year | Jan | Feb | Mar | Apr | May | Jun | Jul | Aug | Sep | Oct | Nov | Dec |
|---|---|---|---|---|---|---|---|---|---|---|---|---|
| 1993 | 0 | 0 | 0 | 0 | 0 | 0 | 0 | 0 | 0 | 0 | 0 | 0 |
| 1994 | 0 | 0 | 0 | 0 | 0 | 0 | 0 | 0 | 0 | 0 | 0 | 0 |
| 1995 | 0 | 0 | 252 | 0 | 214 | 0 | 0 | 216 | 0 | 191 | 229 | 48 |
| 1996 | 0 | 0 | 85 | 0 | 77 | 116 | 353 | 0 | 0 | 0 | 0 | 1 |
| 1997 | 0 | 0 | 0 | 0 | 79 | 0 | 0 | 0 | 0 | 0 | 0 | 0 |
| 1998 | 6 | 5 | 8 | 6 | 9 | 27 | 508 | 229 | 271 | 258 | 8 | 10 |
| 1999 | 17 | 62 | 8 | 20 | 12 | 11 | 11 | 13 | 10 | 9 | 1 | 2 |
| 2000 | 67 | 100 | 1 | 23 | 2 | 0 | 1 | 2 | 4 | 3 | 4 | 2 |
| 2001 | 5 | 246 | 469 | 6 | 206 | 52 | 7 | 192 | 44 | 167 | 3 | 473 |
| 2002 | 225 | 313 | 577 | 478 | 254 | 5 | 2 | 4 | 4 | 4 | 4 | 77 |
| 2003 | 32 | 258 | 6 | 10 | 11 | 6 | 5 | 258 | 3 | 48 | 5 | 23 |
| 2004 | 4 | 147 | 11 | 6 | 289 | 8 | 148 | 5 | 7 | 7 | 7 | 8 |
| 2005 | 34 | 11 | 471 | 495 | 480 | 158 | 704 | 328 | 584 | 460 | 429 | 538 |
| 2006 | 468 | 322 | 429 | 500 | 766 | 317 | 504 | 403 | 381 | 401 | 486 | 559 |
| 2007 | 650 | 11 | 16 | 12 | 179 | 15 | 19 | 1,311 | 152 | 773 | 1,207 | 1,444 |
| 2008 | 206 | 16 | 187 | 731 | 181 | 140 | 331 | 190 | 675 | 1,140 | 447 | 173 |
| 2009 | 107 | 14 | 16 | 266 | 331 | 13 | 221 | 371 | 244 | 258 | 143 | 15 |
| 2010 | 88 | 107 | 213 | 487 | 494 | 609 | 317 | 278 | 341 | 468 | 22 | 341 |
| 2011 | 133 | 146 | 14 | 223 | 144 | 424 | 347 | 302 | 494 | 263 | 232 | 336 |
| 2012 | 692 | 24 | ||||||||||
| - = No Data Reported; -- = Not Applicable; NA = Not Available; W = Withheld to avoid disclosure of individual company data. |
| Release Date: 3/29/2024 |
| Next Release Date: 4/30/2024 |