|
Download Data (XLS File) |
|
||||||||
|
||||||||
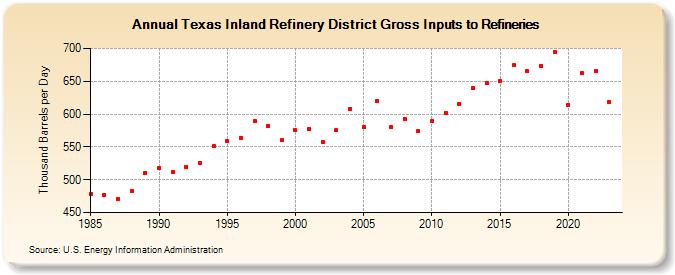
| Texas Inland Refinery District Gross Inputs to Refineries (Thousand Barrels per Day) | ||||||||
| Decade | Year-0 | Year-1 | Year-2 | Year-3 | Year-4 | Year-5 | Year-6 | Year-7 | Year-8 | Year-9 |
|---|---|---|---|---|---|---|---|---|---|---|
| 1980's | 478 | 477 | 471 | 483 | 511 | |||||
| 1990's | 518 | 512 | 520 | 526 | 551 | 559 | 564 | 589 | 582 | 560 |
| 2000's | 575 | 577 | 557 | 575 | 608 | 580 | 620 | 580 | 593 | 574 |
| 2010's | 589 | 602 | 616 | 640 | 648 | 651 | 674 | 665 | 673 | 695 |
| 2020's | 614 | 662 | 666 | 619 |
| - = No Data Reported; -- = Not Applicable; NA = Not Available; W = Withheld to avoid disclosure of individual company data. |
| Release Date: 3/29/2024 |
| Next Release Date: 8/30/2024 |