|
Download Data (XLS File) |
|
||||||||
|
||||||||
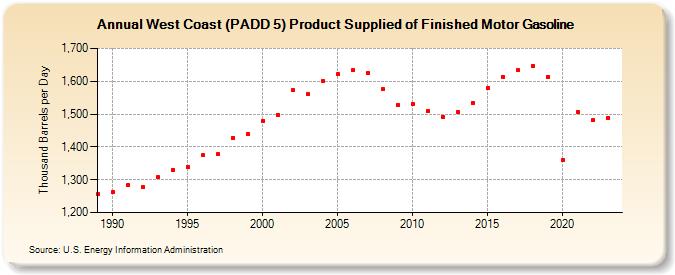
| West Coast (PADD 5) Product Supplied of Finished Motor Gasoline (Thousand Barrels per Day) | ||||||||
| Decade | Year-0 | Year-1 | Year-2 | Year-3 | Year-4 | Year-5 | Year-6 | Year-7 | Year-8 | Year-9 |
|---|---|---|---|---|---|---|---|---|---|---|
| 1980's | 1,256 | |||||||||
| 1990's | 1,263 | 1,283 | 1,277 | 1,307 | 1,331 | 1,340 | 1,374 | 1,377 | 1,428 | 1,439 |
| 2000's | 1,479 | 1,498 | 1,572 | 1,560 | 1,600 | 1,621 | 1,634 | 1,626 | 1,575 | 1,528 |
| 2010's | 1,530 | 1,510 | 1,492 | 1,507 | 1,535 | 1,580 | 1,613 | 1,633 | 1,646 | 1,614 |
| 2020's | 1,360 | 1,507 | 1,481 | 1,489 |
| - = No Data Reported; -- = Not Applicable; NA = Not Available; W = Withheld to avoid disclosure of individual company data. |
| Release Date: 3/29/2024 |
| Next Release Date: 8/30/2024 |