|
Download Data (XLS File) |
|
||||||||
|
||||||||
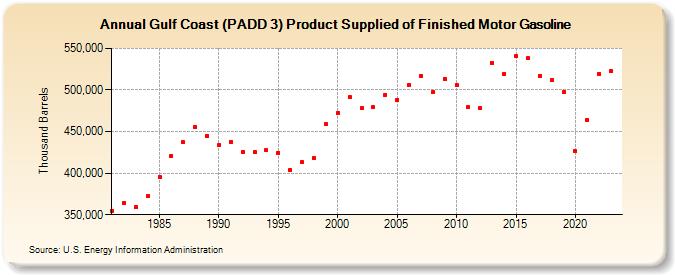
| Gulf Coast (PADD 3) Product Supplied of Finished Motor Gasoline (Thousand Barrels) | ||||||||
| Decade | Year-0 | Year-1 | Year-2 | Year-3 | Year-4 | Year-5 | Year-6 | Year-7 | Year-8 | Year-9 |
|---|---|---|---|---|---|---|---|---|---|---|
| 1980's | 354,964 | 364,414 | 359,096 | 372,449 | 395,860 | 420,927 | 436,985 | 455,586 | 444,870 | |
| 1990's | 433,433 | 437,979 | 425,481 | 425,171 | 427,234 | 424,594 | 403,668 | 412,862 | 417,994 | 458,591 |
| 2000's | 472,907 | 491,029 | 477,867 | 478,987 | 494,133 | 488,293 | 505,782 | 516,940 | 497,394 | 513,506 |
| 2010's | 505,732 | 479,011 | 478,000 | 532,810 | 519,572 | 540,443 | 538,384 | 516,984 | 511,501 | 497,052 |
| 2020's | 426,464 | 463,980 | 519,748 | 522,498 |
| - = No Data Reported; -- = Not Applicable; NA = Not Available; W = Withheld to avoid disclosure of individual company data. |
| Release Date: 3/29/2024 |
| Next Release Date: 8/30/2024 |