|
Download Data (XLS File) |
|
||||||||
|
||||||||
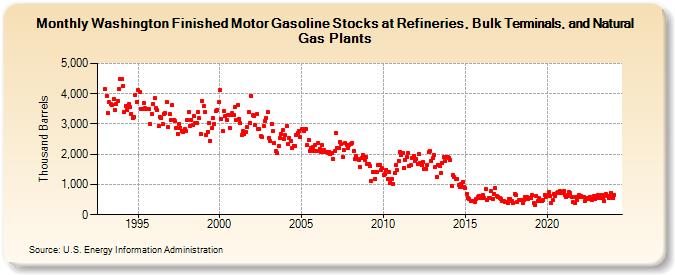
| Washington Finished Motor Gasoline Stocks at Refineries, Bulk Terminals, and Natural Gas Plants (Thousand Barrels) | ||||||||
| Year | Jan | Feb | Mar | Apr | May | Jun | Jul | Aug | Sep | Oct | Nov | Dec |
|---|---|---|---|---|---|---|---|---|---|---|---|---|
| 1993 | 4,147 | 3,935 | 3,359 | 3,722 | 3,653 | 3,632 | 3,826 | 3,474 | 3,676 | 3,769 | 4,163 | 4,486 |
| 1994 | 4,474 | 4,272 | 3,410 | 3,592 | 3,450 | 3,649 | 3,550 | 3,343 | 3,198 | 3,224 | 3,967 | 3,740 |
| 1995 | 4,113 | 4,063 | 3,503 | 3,500 | 3,699 | 3,519 | 3,496 | 3,505 | 3,485 | 3,006 | 3,343 | 3,675 |
| 1996 | 3,849 | 3,534 | 3,460 | 2,923 | 3,230 | 3,192 | 2,990 | 3,334 | 3,349 | 3,731 | 2,886 | 3,315 |
| 1997 | 3,118 | 3,635 | 3,138 | 3,093 | 2,876 | 2,677 | 3,001 | 2,881 | 2,767 | 2,742 | 2,822 | 2,777 |
| 1998 | 3,140 | 3,397 | 2,948 | 3,141 | 2,958 | 3,261 | 3,029 | 3,044 | 3,403 | 3,182 | 2,679 | 3,752 |
| 1999 | 3,581 | 3,390 | 2,644 | 2,750 | 3,041 | 2,447 | 2,865 | 3,201 | 3,009 | 3,440 | 3,457 | 3,711 |
| 2000 | 4,113 | 3,160 | 2,770 | 3,427 | 3,250 | 3,146 | 3,304 | 2,883 | 3,292 | 3,347 | 3,299 | 3,565 |
| 2001 | 3,147 | 3,614 | 3,175 | 3,016 | 2,629 | 2,754 | 2,659 | 2,720 | 2,905 | 3,394 | 3,048 | 3,927 |
| 2002 | 3,289 | 3,254 | 2,957 | 3,314 | 2,844 | 2,844 | 2,595 | 2,568 | 2,941 | 3,105 | 3,207 | 3,385 |
| 2003 | 2,538 | 2,432 | 3,012 | 2,766 | 2,379 | 2,097 | 2,033 | 2,267 | 2,543 | 2,676 | 2,786 | 2,504 |
| 2004 | 2,621 | 2,923 | 2,329 | 2,533 | 2,445 | 2,198 | 2,288 | 2,275 | 2,636 | 2,707 | 2,779 | 2,568 |
| 2005 | 2,849 | 2,829 | 2,764 | 2,828 | 2,297 | 2,475 | 2,117 | 2,191 | 2,232 | 2,094 | 2,301 | 2,108 |
| 2006 | 2,378 | 2,185 | 2,075 | 2,295 | 2,146 | 2,063 | 2,086 | 2,032 | 2,085 | 1,992 | 2,030 | 1,837 |
| 2007 | 2,103 | 2,709 | 2,196 | 2,195 | 2,418 | 2,340 | 1,919 | 2,137 | 2,357 | 2,320 | 2,215 | 2,312 |
| 2008 | 2,340 | 2,384 | 2,110 | 1,841 | 1,925 | 1,854 | 1,818 | 1,580 | 1,879 | 1,967 | 1,818 | 1,902 |
| 2009 | 1,682 | 1,678 | 1,612 | 1,108 | 1,412 | 1,408 | 1,191 | 1,402 | 1,630 | 1,644 | 1,467 | 1,531 |
| 2010 | 1,317 | 1,331 | 1,489 | 1,187 | 1,400 | 1,063 | 1,171 | 1,032 | 1,371 | 1,638 | 1,469 | 1,776 |
| 2011 | 2,078 | 1,973 | 2,038 | 1,551 | 1,822 | 1,906 | 2,049 | 1,610 | 1,631 | 1,888 | 1,935 | 1,792 |
| 2012 | 1,856 | 1,693 | 1,997 | 1,726 | 1,630 | 1,744 | 1,495 | 1,522 | 1,641 | 2,064 | 2,122 | 1,770 |
| 2013 | 1,863 | 1,973 | 1,586 | 1,260 | 1,656 | 1,623 | 1,363 | 1,697 | 1,893 | 1,775 | 1,900 | 1,920 |
| 2014 | 1,873 | 1,794 | 960 | 1,303 | 1,236 | 1,182 | 1,170 | 980 | 920 | 1,012 | 1,080 | 902 |
| 2015 | 868 | 700 | 559 | 513 | 461 | 467 | 452 | 429 | 514 | 571 | 629 | 545 |
| 2016 | 544 | 641 | 553 | 834 | 473 | 553 | 560 | 775 | 521 | 699 | 873 | 612 |
| 2017 | 572 | 537 | 531 | 438 | 457 | 414 | 409 | 387 | 515 | 519 | 445 | 383 |
| 2018 | 691 | 644 | 420 | 473 | 474 | 499 | 380 | 490 | 595 | 595 | 524 | 539 |
| 2019 | 538 | 643 | 398 | 332 | 633 | 448 | 537 | 463 | 465 | 494 | 667 | 591 |
| 2020 | 606 | 751 | 607 | 388 | 475 | 699 | 634 | 713 | 755 | 780 | 711 | 728 |
| 2021 | 782 | 648 | 580 | 608 | 735 | 722 | 584 | 407 | 403 | 589 | 500 | 654 |
| 2022 | 592 | 617 | 571 | 602 | 459 | 539 | 536 | 588 | 527 | 490 | 607 | 533 |
| 2023 | 607 | 644 | 552 | 539 | 667 | 563 | 444 | 681 | 623 | 553 | 626 | 724 |
| 2024 | 541 | |||||||||||
| - = No Data Reported; -- = Not Applicable; NA = Not Available; W = Withheld to avoid disclosure of individual company data. |
| Release Date: 3/29/2024 |
| Next Release Date: 4/30/2024 |