|
Download Data (XLS File) |
|
||||||||
|
||||||||
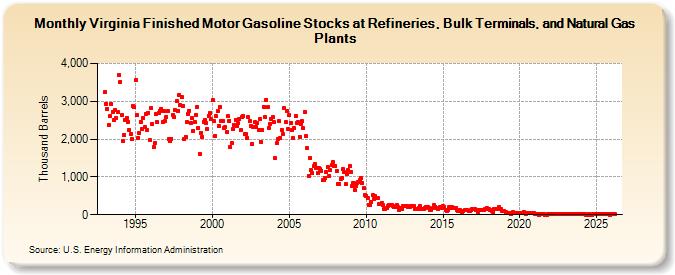
| Virginia Finished Motor Gasoline Stocks at Refineries, Bulk Terminals, and Natural Gas Plants (Thousand Barrels) | ||||||||
| Year | Jan | Feb | Mar | Apr | May | Jun | Jul | Aug | Sep | Oct | Nov | Dec |
|---|---|---|---|---|---|---|---|---|---|---|---|---|
| 1993 | 3,244 | 2,941 | 2,802 | 2,370 | 2,601 | 2,925 | 2,724 | 2,502 | 2,770 | 2,563 | 2,726 | 3,691 |
| 1994 | 3,514 | 2,640 | 1,950 | 2,119 | 2,508 | 2,569 | 2,463 | 2,241 | 2,124 | 2,009 | 2,872 | 2,840 |
| 1995 | 3,553 | 2,634 | 2,026 | 2,166 | 2,462 | 2,266 | 2,568 | 2,317 | 2,673 | 2,244 | 2,700 | 1,966 |
| 1996 | 2,822 | 2,411 | 1,789 | 1,901 | 2,675 | 2,444 | 2,700 | 2,755 | 2,809 | 2,456 | 2,739 | 2,466 |
| 1997 | 2,596 | 2,734 | 2,001 | 1,945 | 2,012 | 2,649 | 2,583 | 2,762 | 3,000 | 2,739 | 3,169 | 2,906 |
| 1998 | 3,105 | 2,885 | 2,004 | 2,066 | 2,449 | 2,665 | 2,751 | 2,433 | 2,551 | 2,226 | 2,453 | 2,648 |
| 1999 | 2,861 | 2,299 | 1,615 | 2,168 | 2,059 | 2,455 | 2,501 | 2,424 | 2,280 | 2,624 | 2,687 | 2,525 |
| 2000 | 3,021 | 2,481 | 2,082 | 2,599 | 2,734 | 2,354 | 2,849 | 2,484 | 2,485 | 2,300 | 2,319 | 2,175 |
| 2001 | 2,601 | 2,490 | 1,794 | 1,898 | 2,264 | 2,369 | 2,517 | 2,347 | 2,422 | 2,520 | 2,242 | 2,574 |
| 2002 | 2,612 | 2,127 | 2,127 | 2,040 | 2,576 | 2,472 | 2,335 | 1,879 | 2,320 | 2,444 | 2,321 | 2,424 |
| 2003 | 2,249 | 2,527 | 1,932 | 2,241 | 2,861 | 2,587 | 3,041 | 2,836 | 2,304 | 2,410 | 2,531 | 2,582 |
| 2004 | 2,444 | 1,487 | 1,902 | 2,003 | 2,478 | 2,029 | 2,248 | 2,142 | 2,821 | 2,446 | 2,748 | 2,260 |
| 2005 | 2,628 | 2,439 | 2,239 | 2,017 | 2,291 | 2,611 | 2,420 | 2,450 | 2,066 | 2,389 | 2,477 | 2,284 |
| 2006 | 2,729 | 2,076 | 1,755 | 1,028 | 1,513 | 1,172 | 1,102 | 1,288 | 1,343 | 1,243 | 1,098 | 1,224 |
| 2007 | 1,215 | 1,166 | 908 | 912 | 963 | 1,127 | 1,254 | 1,018 | 1,171 | 1,312 | 1,385 | 1,289 |
| 2008 | 1,285 | 1,166 | 817 | 822 | 939 | 969 | 1,205 | 1,119 | 818 | 1,090 | 1,171 | 1,285 |
| 2009 | 1,129 | 751 | 846 | 661 | 768 | 836 | 854 | 915 | 973 | 841 | 705 | 523 |
| 2010 | 498 | 446 | 265 | 257 | 338 | 520 | 427 | 489 | 449 | 448 | 283 | 274 |
| 2011 | 317 | 261 | 146 | 148 | 180 | 218 | 257 | 256 | 266 | 242 | 211 | 213 |
| 2012 | 260 | 201 | 136 | 173 | 154 | 239 | 236 | 224 | 239 | 194 | 200 | 235 |
| 2013 | 231 | 220 | 156 | 157 | 156 | 183 | 223 | 163 | 138 | 147 | 188 | 214 |
| 2014 | 210 | 182 | 118 | 133 | 167 | 247 | 216 | 169 | 147 | 176 | 193 | 189 |
| 2015 | 226 | 205 | 137 | 89 | 128 | 196 | 187 | 192 | 178 | 167 | 176 | 134 |
| 2016 | 105 | 127 | 109 | 66 | 103 | 122 | 130 | 122 | 101 | 95 | 123 | 150 |
| 2017 | 141 | 149 | 127 | 79 | 114 | 118 | 128 | 137 | 113 | 138 | 166 | 150 |
| 2018 | 141 | 135 | 98 | 78 | 161 | 146 | 164 | 151 | 193 | 140 | 111 | 91 |
| 2019 | 96 | 78 | 55 | 37 | 33 | 30 | 52 | 65 | 54 | 55 | 57 | 44 |
| 2020 | 54 | 36 | 41 | 59 | 44 | 31 | 41 | 43 | 33 | 34 | 47 | 41 |
| 2021 | 20 | 19 | 12 | 5 | 23 | 8 | 9 | 6 | 5 | 4 | 12 | 29 |
| 2022 | 18 | 13 | 18 | 14 | 14 | 8 | 6 | 7 | 15 | 16 | 9 | 22 |
| 2023 | 23 | 24 | 8 | 8 | 28 | 15 | 9 | 31 | 21 | 20 | 13 | 21 |
| 2024 | 25 | |||||||||||
| - = No Data Reported; -- = Not Applicable; NA = Not Available; W = Withheld to avoid disclosure of individual company data. |
| Release Date: 3/29/2024 |
| Next Release Date: 4/30/2024 |