|
Download Data (XLS File) |
|
||||||||
|
||||||||
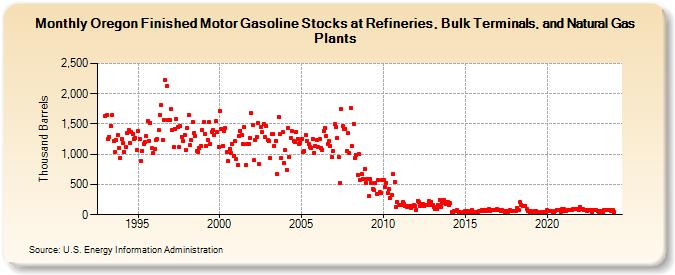
| Oregon Finished Motor Gasoline Stocks at Refineries, Bulk Terminals, and Natural Gas Plants (Thousand Barrels) | ||||||||
| Year | Jan | Feb | Mar | Apr | May | Jun | Jul | Aug | Sep | Oct | Nov | Dec |
|---|---|---|---|---|---|---|---|---|---|---|---|---|
| 1993 | 1,625 | 1,641 | 1,254 | 1,289 | 1,468 | 1,653 | 1,216 | 1,043 | 1,232 | 1,310 | 1,106 | 943 |
| 1994 | 1,249 | 1,184 | 1,029 | 1,122 | 1,346 | 1,397 | 1,193 | 1,368 | 1,337 | 1,247 | 1,272 | 1,066 |
| 1995 | 1,382 | 1,248 | 886 | 1,061 | 1,174 | 1,194 | 1,293 | 1,548 | 1,225 | 1,522 | 1,096 | 1,016 |
| 1996 | 1,081 | 1,227 | 1,251 | 1,393 | 1,650 | 1,816 | 1,240 | 1,562 | 2,225 | 2,133 | 1,564 | 1,572 |
| 1997 | 1,743 | 1,400 | 1,117 | 1,423 | 1,583 | 1,448 | 1,117 | 1,469 | 1,286 | 1,225 | 1,315 | 1,068 |
| 1998 | 1,430 | 1,655 | 1,149 | 1,231 | 1,534 | 1,344 | 1,305 | 1,059 | 1,043 | 1,095 | 1,133 | 1,402 |
| 1999 | 1,528 | 1,334 | 1,138 | 1,238 | 1,529 | 1,161 | 1,370 | 1,400 | 1,321 | 1,553 | 1,364 | 1,120 |
| 2000 | 1,721 | 1,419 | 1,135 | 1,390 | 1,426 | 1,032 | 881 | 1,094 | 1,022 | 1,170 | 969 | 1,212 |
| 2001 | 916 | 820 | 1,305 | 1,391 | 1,318 | 1,161 | 1,451 | 820 | 1,173 | 1,175 | 1,271 | 1,684 |
| 2002 | 1,484 | 897 | 1,236 | 1,292 | 1,514 | 843 | 1,442 | 1,363 | 1,507 | 1,291 | 1,462 | 1,235 |
| 2003 | 1,217 | 941 | 1,334 | 1,341 | 1,139 | 1,226 | 667 | 1,611 | 1,327 | 939 | 1,375 | 860 |
| 2004 | 1,063 | 745 | 1,434 | 957 | 1,265 | 1,383 | 1,216 | 1,199 | 1,374 | 1,257 | 1,169 | 1,193 |
| 2005 | 1,258 | 1,030 | 1,059 | 1,316 | 1,223 | 1,168 | 1,116 | 1,104 | 1,253 | 1,025 | 1,142 | 1,240 |
| 2006 | 1,117 | 1,245 | 1,096 | 1,073 | 1,385 | 1,429 | 1,305 | 1,171 | 1,226 | 1,140 | 958 | 1,060 |
| 2007 | 1,500 | 1,452 | 1,275 | 955 | 531 | 1,743 | 1,463 | 1,414 | 1,423 | 1,058 | 1,345 | 1,014 |
| 2008 | 1,764 | 1,132 | 1,505 | 940 | 991 | 658 | 997 | 580 | 675 | 594 | 752 | 525 |
| 2009 | 584 | 303 | 598 | 528 | 429 | 405 | 518 | 344 | 571 | 375 | 360 | 577 |
| 2010 | 579 | 461 | 525 | 362 | 418 | 275 | 324 | 674 | 544 | 135 | 218 | 165 |
| 2011 | 166 | 159 | 204 | 178 | 145 | 134 | 152 | 147 | 117 | 148 | 153 | 142 |
| 2012 | 81 | 232 | 212 | 136 | 180 | 173 | 146 | 166 | 154 | 225 | 161 | 218 |
| 2013 | 155 | 130 | 95 | 100 | 162 | 251 | 121 | 190 | 235 | 204 | 181 | 206 |
| 2014 | 155 | 189 | 44 | 40 | 54 | 60 | 73 | 47 | 53 | 34 | 25 | 50 |
| 2015 | 59 | 50 | 56 | 39 | 52 | 71 | 51 | 43 | 40 | 41 | 55 | 69 |
| 2016 | 78 | 56 | 86 | 58 | 80 | 94 | 60 | 70 | 79 | 78 | 81 | 94 |
| 2017 | 73 | 75 | 58 | 73 | 64 | 52 | 62 | 49 | 67 | 73 | 54 | 68 |
| 2018 | 67 | 69 | 108 | 79 | 203 | 165 | 144 | 141 | 151 | 89 | 65 | 39 |
| 2019 | 57 | 40 | 34 | 65 | 60 | 37 | 34 | 34 | 45 | 32 | 53 | 49 |
| 2020 | 72 | 58 | 62 | 58 | 50 | 35 | 59 | 78 | 72 | 80 | 45 | 96 |
| 2021 | 96 | 69 | 61 | 80 | 78 | 78 | 81 | 87 | 87 | 95 | 99 | 80 |
| 2022 | 132 | 87 | 98 | 85 | 80 | 67 | 71 | 79 | 73 | 41 | 77 | 85 |
| 2023 | 78 | 60 | 51 | 63 | 57 | 42 | 71 | 86 | 79 | 83 | 71 | 54 |
| 2024 | 70 | |||||||||||
| - = No Data Reported; -- = Not Applicable; NA = Not Available; W = Withheld to avoid disclosure of individual company data. |
| Release Date: 3/29/2024 |
| Next Release Date: 4/30/2024 |