|
Download Data (XLS File) |
|
||||||||
|
||||||||
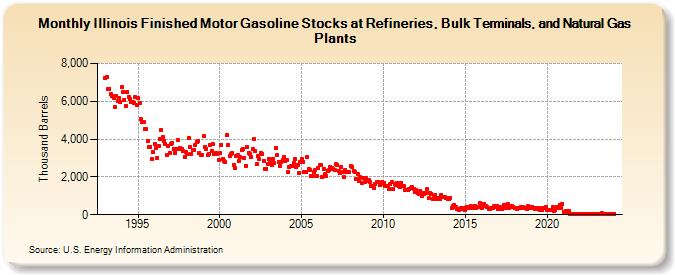
| Illinois Finished Motor Gasoline Stocks at Refineries, Bulk Terminals, and Natural Gas Plants (Thousand Barrels) | ||||||||
| Year | Jan | Feb | Mar | Apr | May | Jun | Jul | Aug | Sep | Oct | Nov | Dec |
|---|---|---|---|---|---|---|---|---|---|---|---|---|
| 1993 | 7,222 | 7,311 | 6,647 | 6,676 | 6,377 | 6,282 | 6,189 | 5,713 | 6,254 | 6,029 | 6,193 | 5,943 |
| 1994 | 6,743 | 6,501 | 6,070 | 5,748 | 6,515 | 6,211 | 6,145 | 5,965 | 5,959 | 5,931 | 6,216 | 5,823 |
| 1995 | 6,157 | 5,895 | 5,044 | 4,910 | 4,884 | 4,524 | 4,530 | 3,875 | 3,573 | 3,607 | 2,958 | 3,297 |
| 1996 | 3,735 | 3,529 | 3,011 | 3,615 | 4,024 | 4,494 | 4,108 | 3,920 | 3,752 | 3,137 | 3,642 | 3,284 |
| 1997 | 3,722 | 3,805 | 3,472 | 3,285 | 3,489 | 3,927 | 3,472 | 3,514 | 3,490 | 3,372 | 3,068 | 3,312 |
| 1998 | 3,194 | 4,048 | 3,607 | 3,226 | 3,445 | 3,434 | 3,678 | 3,855 | 3,876 | 3,276 | 3,146 | 3,155 |
| 1999 | 4,142 | 3,604 | 3,494 | 3,150 | 3,205 | 3,703 | 3,391 | 3,737 | 3,236 | 3,271 | 3,200 | 2,906 |
| 2000 | 3,262 | 3,681 | 2,946 | 2,859 | 2,767 | 4,201 | 3,696 | 3,099 | 3,200 | 3,270 | 2,634 | 2,473 |
| 2001 | 3,119 | 3,139 | 2,850 | 3,041 | 3,437 | 3,501 | 3,006 | 2,592 | 3,579 | 3,274 | 3,195 | 3,076 |
| 2002 | 3,471 | 4,012 | 3,361 | 2,663 | 3,087 | 2,923 | 3,252 | 3,209 | 2,865 | 2,416 | 2,439 | 2,658 |
| 2003 | 2,948 | 2,723 | 2,639 | 2,969 | 2,730 | 3,518 | 3,179 | 2,795 | 2,603 | 2,774 | 2,913 | 3,051 |
| 2004 | 2,838 | 2,905 | 2,245 | 2,500 | 2,554 | 2,562 | 2,723 | 2,933 | 2,507 | 2,650 | 2,228 | 2,797 |
| 2005 | 2,929 | 2,802 | 2,243 | 2,271 | 3,044 | 2,396 | 2,360 | 2,058 | 2,059 | 2,236 | 2,341 | 2,071 |
| 2006 | 2,452 | 2,608 | 2,633 | 2,020 | 2,428 | 2,136 | 2,059 | 2,336 | 2,363 | 2,532 | 2,490 | 2,407 |
| 2007 | 2,374 | 2,679 | 2,609 | 2,325 | 2,197 | 2,542 | 2,278 | 1,971 | 2,351 | 2,271 | 2,255 | 2,251 |
| 2008 | 2,575 | 2,524 | 2,332 | 2,262 | 1,865 | 2,172 | 1,785 | 1,994 | 1,680 | 1,949 | 1,732 | 1,940 |
| 2009 | 1,786 | 1,819 | 1,739 | 1,506 | 1,522 | 1,437 | 1,605 | 1,733 | 1,748 | 1,556 | 1,603 | 1,739 |
| 2010 | 1,704 | 1,540 | 1,528 | 1,528 | 1,347 | 1,608 | 1,711 | 1,381 | 1,641 | 1,556 | 1,680 | 1,525 |
| 2011 | 1,471 | 1,682 | 1,529 | 1,499 | 1,298 | 1,316 | 1,305 | 1,337 | 1,391 | 1,464 | 1,374 | 1,214 |
| 2012 | 1,287 | 1,137 | 1,100 | 1,240 | 1,016 | 1,167 | 1,113 | 1,141 | 1,340 | 862 | 1,132 | 1,110 |
| 2013 | 836 | 924 | 1,045 | 847 | 896 | 827 | 1,027 | 924 | 949 | 940 | 882 | 826 |
| 2014 | 827 | 885 | 355 | 485 | 525 | 392 | 319 | 272 | 323 | 360 | 321 | 356 |
| 2015 | 260 | 431 | 383 | 340 | 437 | 359 | 374 | 450 | 347 | 414 | 428 | 605 |
| 2016 | 360 | 543 | 543 | 451 | 428 | 325 | 282 | 376 | 355 | 451 | 418 | 475 |
| 2017 | 314 | 420 | 349 | 326 | 499 | 339 | 515 | 557 | 349 | 457 | 445 | 410 |
| 2018 | 351 | 348 | 324 | 364 | 345 | 397 | 419 | 345 | 341 | 319 | 442 | 330 |
| 2019 | 394 | 433 | 366 | 288 | 344 | 307 | 354 | 247 | 234 | 368 | 334 | 425 |
| 2020 | 271 | 239 | 271 | 245 | 401 | 184 | 264 | 401 | 346 | 531 | 378 | 555 |
| 2021 | 149 | 145 | 188 | 167 | 178 | 44 | 49 | 36 | 34 | 37 | 37 | 30 |
| 2022 | 40 | 44 | 35 | 60 | 42 | 33 | 40 | 48 | 61 | 47 | 38 | 34 |
| 2023 | 44 | 29 | 23 | 19 | 70 | 55 | 39 | 55 | 38 | 44 | 52 | 38 |
| 2024 | 43 | |||||||||||
| - = No Data Reported; -- = Not Applicable; NA = Not Available; W = Withheld to avoid disclosure of individual company data. |
| Release Date: 3/29/2024 |
| Next Release Date: 4/30/2024 |