|
Download Data (XLS File) |
|
||||||||
|
||||||||
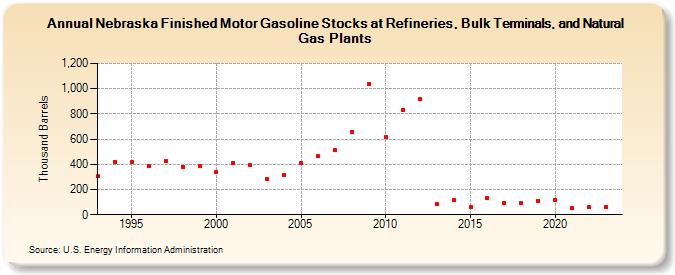
| Nebraska Finished Motor Gasoline Stocks at Refineries, Bulk Terminals, and Natural Gas Plants (Thousand Barrels) | ||||||||
| Decade | Year-0 | Year-1 | Year-2 | Year-3 | Year-4 | Year-5 | Year-6 | Year-7 | Year-8 | Year-9 |
|---|---|---|---|---|---|---|---|---|---|---|
| 1990's | 307 | 421 | 417 | 387 | 427 | 382 | 383 | |||
| 2000's | 339 | 412 | 396 | 281 | 318 | 414 | 463 | 511 | 658 | 1,036 |
| 2010's | 620 | 832 | 917 | 88 | 118 | 65 | 134 | 92 | 92 | 111 |
| 2020's | 116 | 51 | 58 | 60 |
| - = No Data Reported; -- = Not Applicable; NA = Not Available; W = Withheld to avoid disclosure of individual company data. |
| Release Date: 3/29/2024 |
| Next Release Date: 8/30/2024 |