|
Download Data (XLS File) |
|
||||||||
|
||||||||
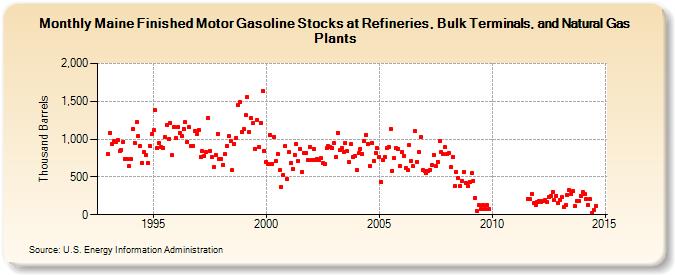
| Maine Finished Motor Gasoline Stocks at Refineries, Bulk Terminals, and Natural Gas Plants (Thousand Barrels) | ||||||||
| Year | Jan | Feb | Mar | Apr | May | Jun | Jul | Aug | Sep | Oct | Nov | Dec |
|---|---|---|---|---|---|---|---|---|---|---|---|---|
| 1993 | 800 | 1,087 | 940 | 979 | 959 | 989 | 841 | 862 | 963 | 741 | 735 | 638 |
| 1994 | 733 | 1,131 | 952 | 1,224 | 1,043 | 909 | 686 | 824 | 784 | 687 | 915 | 1,062 |
| 1995 | 1,114 | 1,381 | 883 | 954 | 889 | 887 | 1,028 | 1,183 | 997 | 1,217 | 784 | 1,166 |
| 1996 | 1,010 | 1,157 | 1,084 | 1,041 | 1,135 | 1,220 | 960 | 1,161 | 908 | 911 | 1,112 | 1,072 |
| 1997 | 1,121 | 766 | 836 | 782 | 824 | 1,279 | 847 | 757 | 630 | 786 | 1,074 | 742 |
| 1998 | 737 | 664 | 797 | 911 | 1,035 | 977 | 588 | 932 | 1,021 | 1,448 | 1,484 | 1,094 |
| 1999 | 1,127 | 1,315 | 1,554 | 1,091 | 1,273 | 1,214 | 875 | 1,255 | 889 | 1,213 | 1,637 | 845 |
| 2000 | 703 | 671 | 1,053 | 677 | 1,033 | 707 | 798 | 587 | 371 | 526 | 906 | 468 |
| 2001 | 828 | 687 | 608 | 796 | 937 | 707 | 875 | 565 | 822 | 821 | 726 | 894 |
| 2002 | 729 | 867 | 718 | 737 | 728 | 745 | 687 | 666 | 878 | 906 | 897 | 881 |
| 2003 | 952 | 763 | 1,086 | 851 | 880 | 825 | 948 | 836 | 691 | 930 | 761 | 782 |
| 2004 | 593 | 812 | 868 | 809 | 975 | 1,060 | 930 | 644 | 953 | 712 | 813 | 877 |
| 2005 | 764 | 434 | 728 | 763 | 877 | 898 | 1,140 | 584 | 749 | 877 | 872 | 641 |
| 2006 | 834 | 777 | 615 | 591 | 920 | 713 | 643 | 1,104 | 699 | 832 | 1,027 | 586 |
| 2007 | 578 | 554 | 583 | 594 | 653 | 793 | 640 | 700 | 971 | 826 | 799 | 889 |
| 2008 | 800 | 814 | 627 | 765 | 376 | 564 | 479 | 381 | 445 | 565 | 425 | 374 |
| 2009 | 439 | 550 | 450 | 225 | 43 | 122 | 79 | 126 | 74 | 126 | 81 | |
| 2010 | 45 | |||||||||||
| 2011 | 211 | 203 | 271 | 150 | 130 | |||||||
| 2012 | 163 | 187 | 165 | 186 | 188 | 171 | 229 | 248 | 301 | 190 | 251 | 152 |
| 2013 | 198 | 229 | 98 | 126 | 263 | 324 | 270 | 310 | 112 | 183 | 183 | 254 |
| 2014 | 295 | 271 | 213 | 134 | 203 | 24 | 62 | 114 | ||||
| - = No Data Reported; -- = Not Applicable; NA = Not Available; W = Withheld to avoid disclosure of individual company data. |
| Release Date: 8/30/2024 |
| Next Release Date: 9/30/2024 |