|
Download Data (XLS File) |
|
||||||||
|
||||||||
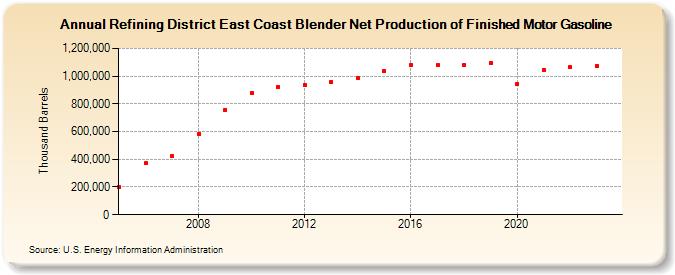
| Refining District East Coast Blender Net Production of Finished Motor Gasoline (Thousand Barrels) | ||||||||
| Decade | Year-0 | Year-1 | Year-2 | Year-3 | Year-4 | Year-5 | Year-6 | Year-7 | Year-8 | Year-9 |
|---|---|---|---|---|---|---|---|---|---|---|
| 2000's | 199,173 | 371,134 | 420,199 | 585,797 | 757,889 | |||||
| 2010's | 878,183 | 922,275 | 936,493 | 961,054 | 987,956 | 1,035,012 | 1,080,554 | 1,080,572 | 1,082,718 | 1,096,399 |
| 2020's | 944,119 | 1,047,415 | 1,064,641 | 1,075,150 |
| - = No Data Reported; -- = Not Applicable; NA = Not Available; W = Withheld to avoid disclosure of individual company data. |
| Release Date: 3/29/2024 |
| Next Release Date: 8/30/2024 |