|
Download Data (XLS File) |
|
||||||||
|
||||||||
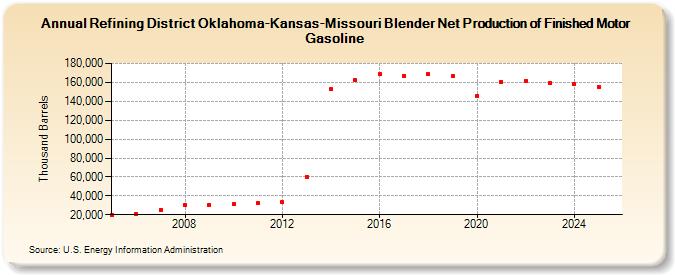
| Refining District Oklahoma-Kansas-Missouri Blender Net Production of Finished Motor Gasoline (Thousand Barrels) | ||||||||
| Decade | Year-0 | Year-1 | Year-2 | Year-3 | Year-4 | Year-5 | Year-6 | Year-7 | Year-8 | Year-9 |
|---|---|---|---|---|---|---|---|---|---|---|
| 2000's | 20,032 | 20,493 | 25,370 | 30,239 | 30,205 | |||||
| 2010's | 31,179 | 32,632 | 33,114 | 60,362 | 152,522 | 162,002 | 168,765 | 167,030 | 168,530 | 166,458 |
| 2020's | 145,782 | 160,565 | 161,783 | 159,624 |
| - = No Data Reported; -- = Not Applicable; NA = Not Available; W = Withheld to avoid disclosure of individual company data. |
| Release Date: 8/30/2024 |
| Next Release Date: 8/29/2025 |