|
Download Data (XLS File) |
|
||||||||
|
||||||||
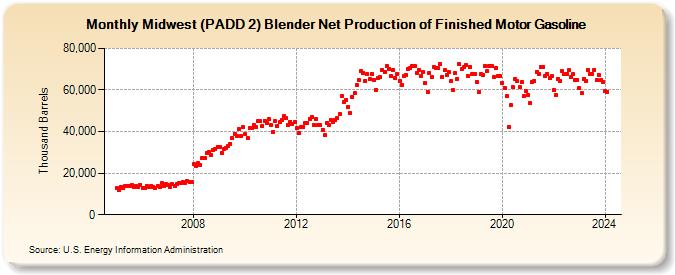
| Midwest (PADD 2) Blender Net Production of Finished Motor Gasoline (Thousand Barrels) | ||||||||
| Year | Jan | Feb | Mar | Apr | May | Jun | Jul | Aug | Sep | Oct | Nov | Dec |
|---|---|---|---|---|---|---|---|---|---|---|---|---|
| 2005 | 12,669 | 11,846 | 13,484 | 12,757 | 13,761 | 13,816 | 13,967 | 14,233 | 13,137 | 13,839 | 13,456 | 14,517 |
| 2006 | 12,947 | 12,713 | 13,845 | 13,404 | 13,925 | 13,428 | 12,895 | 13,855 | 13,270 | 15,239 | 14,041 | 14,838 |
| 2007 | 14,403 | 13,386 | 14,579 | 13,983 | 14,752 | 15,144 | 15,310 | 15,710 | 15,322 | 16,107 | 15,629 | 15,757 |
| 2008 | 24,360 | 23,621 | 24,828 | 24,112 | 27,515 | 27,336 | 29,710 | 30,338 | 28,550 | 31,153 | 31,719 | 32,792 |
| 2009 | 32,492 | 29,920 | 31,714 | 32,318 | 33,017 | 34,247 | 36,730 | 38,709 | 38,053 | 41,340 | 37,722 | 42,010 |
| 2010 | 38,746 | 37,011 | 41,581 | 41,739 | 43,127 | 42,062 | 45,074 | 44,913 | 42,777 | 45,227 | 44,123 | 45,887 |
| 2011 | 43,259 | 40,001 | 44,895 | 42,802 | 44,453 | 45,509 | 47,364 | 46,492 | 43,288 | 44,835 | 43,605 | 44,452 |
| 2012 | 41,517 | 39,302 | 41,977 | 42,081 | 44,234 | 44,198 | 46,175 | 46,840 | 43,059 | 46,078 | 43,330 | 43,101 |
| 2013 | 40,912 | 38,211 | 44,007 | 43,078 | 45,571 | 44,621 | 45,667 | 46,437 | 48,229 | 57,143 | 54,222 | 55,011 |
| 2014 | 52,040 | 48,868 | 56,687 | 58,410 | 62,392 | 64,731 | 69,082 | 68,339 | 64,543 | 67,542 | 65,258 | 67,748 |
| 2015 | 64,986 | 59,870 | 65,594 | 66,020 | 69,501 | 68,528 | 71,586 | 70,285 | 66,825 | 69,594 | 65,753 | 67,581 |
| 2016 | 64,272 | 62,503 | 66,798 | 67,295 | 70,292 | 70,359 | 71,410 | 71,655 | 68,214 | 69,580 | 66,894 | 68,758 |
| 2017 | 63,283 | 59,120 | 68,321 | 66,016 | 70,995 | 70,719 | 70,489 | 72,350 | 66,332 | 69,464 | 67,313 | 68,511 |
| 2018 | 64,272 | 59,977 | 68,041 | 65,455 | 72,336 | 70,046 | 71,032 | 71,948 | 66,587 | 71,137 | 67,807 | 67,790 |
| 2019 | 63,741 | 58,990 | 67,513 | 67,010 | 71,645 | 68,934 | 71,741 | 71,734 | 66,004 | 70,755 | 66,888 | 66,661 |
| 2020 | 63,427 | 61,163 | 57,015 | 42,096 | 52,660 | 61,209 | 65,132 | 64,131 | 61,271 | 63,629 | 57,335 | 59,352 |
| 2021 | 57,499 | 53,586 | 63,967 | 64,502 | 68,786 | 67,882 | 71,264 | 71,165 | 66,577 | 67,684 | 65,615 | 66,554 |
| 2022 | 60,058 | 57,425 | 65,412 | 64,361 | 69,123 | 67,466 | 67,833 | 69,466 | 66,030 | 67,590 | 64,743 | 64,681 |
| 2023 | 61,010 | 58,640 | 65,492 | 64,264 | 69,510 | 67,732 | 67,742 | 69,832 | 64,667 | 67,220 | 64,559 | 64,062 |
| 2024 | 59,729 | |||||||||||
| - = No Data Reported; -- = Not Applicable; NA = Not Available; W = Withheld to avoid disclosure of individual company data. |
| Release Date: 3/29/2024 |
| Next Release Date: 4/30/2024 |