|
Download Data (XLS File) |
|
||||||||
|
||||||||
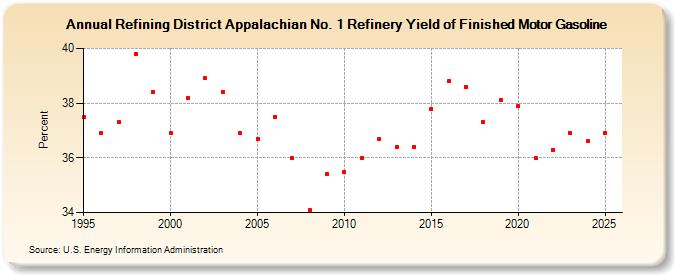
| Refining District Appalachian No. 1 Refinery Yield of Finished Motor Gasoline (Percent) | ||||||||
| Decade | Year-0 | Year-1 | Year-2 | Year-3 | Year-4 | Year-5 | Year-6 | Year-7 | Year-8 | Year-9 |
|---|---|---|---|---|---|---|---|---|---|---|
| 1990's | 37.5 | 36.9 | 37.3 | 39.8 | 38.4 | |||||
| 2000's | 36.9 | 38.2 | 38.9 | 38.4 | 36.9 | 36.7 | 37.5 | 36.0 | 34.1 | 35.4 |
| 2010's | 35.5 | 36.0 | 36.7 | 36.4 | 36.4 | 37.8 | 38.8 | 38.6 | 37.3 | 38.1 |
| 2020's | 37.9 | 36.0 | 36.3 | 36.9 |
| - = No Data Reported; -- = Not Applicable; NA = Not Available; W = Withheld to avoid disclosure of individual company data. |
| Release Date: 8/30/2024 |
| Next Release Date: 8/29/2025 |