|
Download Data (XLS File) |
|
||||||||
|
||||||||
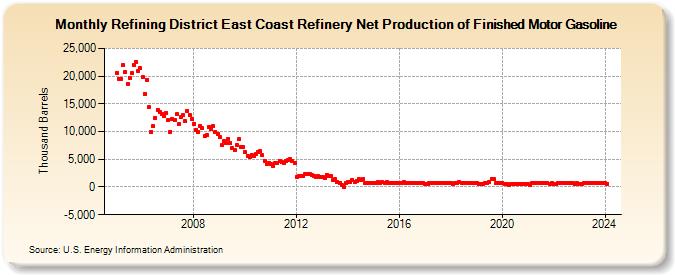
| Refining District East Coast Refinery Net Production of Finished Motor Gasoline (Thousand Barrels) | ||||||||
| Year | Jan | Feb | Mar | Apr | May | Jun | Jul | Aug | Sep | Oct | Nov | Dec |
|---|---|---|---|---|---|---|---|---|---|---|---|---|
| 2005 | 20,603 | 19,547 | 19,484 | 21,915 | 20,703 | 18,640 | 19,746 | 20,505 | 22,018 | 22,595 | 20,927 | 21,398 |
| 2006 | 19,794 | 16,801 | 19,373 | 14,423 | 9,968 | 10,945 | 12,503 | 13,935 | 13,603 | 13,187 | 12,848 | 13,376 |
| 2007 | 12,156 | 10,009 | 12,179 | 12,130 | 13,106 | 11,440 | 12,576 | 13,010 | 11,845 | 13,760 | 12,954 | 12,276 |
| 2008 | 11,452 | 10,364 | 9,925 | 11,034 | 10,576 | 9,163 | 9,397 | 10,839 | 10,489 | 10,965 | 9,930 | 9,524 |
| 2009 | 8,944 | 7,574 | 8,235 | 7,910 | 8,729 | 7,911 | 7,006 | 6,734 | 7,571 | 8,594 | 7,225 | 7,178 |
| 2010 | 6,257 | 5,585 | 5,395 | 5,739 | 5,529 | 5,932 | 6,370 | 6,405 | 5,716 | 4,776 | 4,208 | 4,415 |
| 2011 | 4,102 | 3,804 | 4,362 | 4,304 | 4,624 | 4,474 | 4,396 | 4,643 | 4,889 | 4,964 | 4,762 | 4,284 |
| 2012 | 1,876 | 1,979 | 1,916 | 2,054 | 2,378 | 2,307 | 2,260 | 2,207 | 2,023 | 1,850 | 1,974 | 1,724 |
| 2013 | 1,868 | 1,545 | 2,228 | 2,045 | 1,989 | 1,267 | 1,364 | 966 | 701 | 293 | -52 | 711 |
| 2014 | 868 | 865 | 1,280 | 826 | 1,130 | 1,366 | 1,233 | 1,361 | 780 | 773 | 786 | 779 |
| 2015 | 714 | 705 | 839 | 752 | 856 | 780 | 871 | 784 | 683 | 756 | 656 | 694 |
| 2016 | 659 | 652 | 834 | 716 | 768 | 805 | 777 | 777 | 744 | 768 | 729 | 735 |
| 2017 | 593 | 566 | 706 | 669 | 684 | 634 | 745 | 780 | 749 | 787 | 738 | 739 |
| 2018 | 663 | 619 | 807 | 702 | 815 | 689 | 726 | 688 | 702 | 730 | 672 | 654 |
| 2019 | 655 | 526 | 599 | 550 | 684 | 680 | 831 | 1,439 | 1,407 | 709 | 676 | 707 |
| 2020 | 678 | 627 | 600 | 403 | 469 | 536 | 577 | 608 | 578 | 546 | 501 | 515 |
| 2021 | 497 | 448 | 634 | 687 | 746 | 735 | 762 | 708 | 652 | 712 | 617 | 704 |
| 2022 | 572 | 605 | 694 | 769 | 635 | 697 | 754 | 786 | 713 | 684 | 621 | 652 |
| 2023 | 618 | 609 | 669 | 664 | 645 | 647 | 677 | 678 | 641 | 687 | 673 | 655 |
| 2024 | 633 | 592 | ||||||||||
| - = No Data Reported; -- = Not Applicable; NA = Not Available; W = Withheld to avoid disclosure of individual company data. |
| Release Date: 4/30/2024 |
| Next Release Date: 5/31/2024 |