|
Download Data (XLS File) |
|
||||||||
|
||||||||
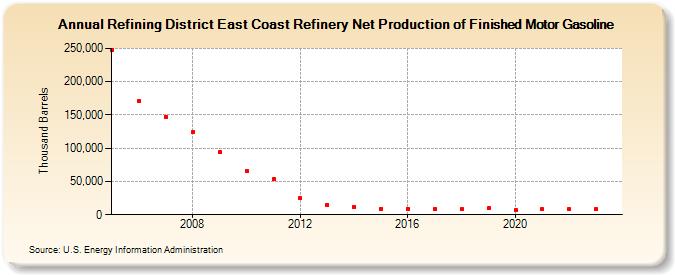
| Refining District East Coast Refinery Net Production of Finished Motor Gasoline (Thousand Barrels) | ||||||||
| Decade | Year-0 | Year-1 | Year-2 | Year-3 | Year-4 | Year-5 | Year-6 | Year-7 | Year-8 | Year-9 |
|---|---|---|---|---|---|---|---|---|---|---|
| 2000's | 248,081 | 170,756 | 147,441 | 123,658 | 93,611 | |||||
| 2010's | 66,327 | 53,608 | 24,548 | 14,925 | 12,047 | 9,090 | 8,964 | 8,390 | 8,467 | 9,463 |
| 2020's | 6,638 | 7,902 | 8,182 | 7,863 |
| - = No Data Reported; -- = Not Applicable; NA = Not Available; W = Withheld to avoid disclosure of individual company data. |
| Release Date: 8/30/2024 |
| Next Release Date: 8/29/2025 |