|
Download Data (XLS File) |
|
||||||||
|
||||||||
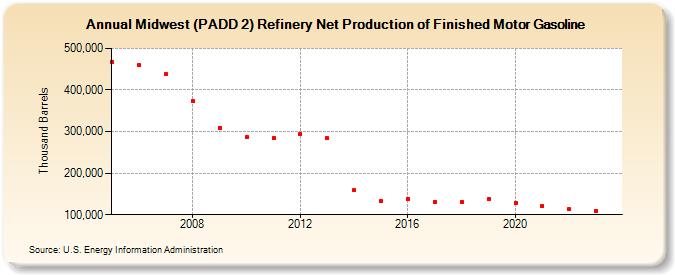
| Midwest (PADD 2) Refinery Net Production of Finished Motor Gasoline (Thousand Barrels) | ||||||||
| Decade | Year-0 | Year-1 | Year-2 | Year-3 | Year-4 | Year-5 | Year-6 | Year-7 | Year-8 | Year-9 |
|---|---|---|---|---|---|---|---|---|---|---|
| 2000's | 467,849 | 460,291 | 438,109 | 372,760 | 309,351 | |||||
| 2010's | 285,727 | 284,729 | 293,540 | 283,706 | 158,775 | 131,877 | 137,256 | 131,188 | 131,284 | 137,770 |
| 2020's | 128,565 | 121,358 | 112,907 | 109,785 |
| - = No Data Reported; -- = Not Applicable; NA = Not Available; W = Withheld to avoid disclosure of individual company data. |
| Release Date: 8/30/2024 |
| Next Release Date: 8/29/2025 |