|
Download Data (XLS File) |
|
||||||||
|
||||||||
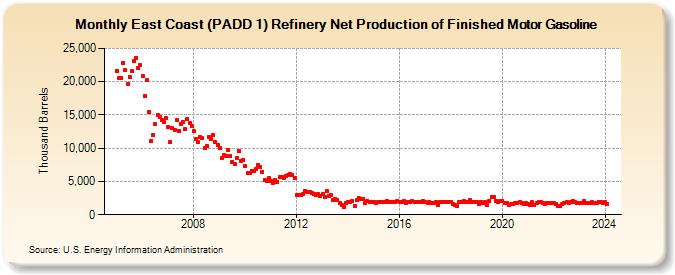
| East Coast (PADD 1) Refinery Net Production of Finished Motor Gasoline (Thousand Barrels) | ||||||||
| Year | Jan | Feb | Mar | Apr | May | Jun | Jul | Aug | Sep | Oct | Nov | Dec |
|---|---|---|---|---|---|---|---|---|---|---|---|---|
| 2005 | 21,608 | 20,482 | 20,544 | 22,853 | 21,788 | 19,651 | 20,766 | 21,552 | 23,092 | 23,629 | 22,024 | 22,464 |
| 2006 | 20,870 | 17,808 | 20,202 | 15,447 | 11,055 | 11,938 | 13,576 | 15,006 | 14,631 | 14,268 | 14,003 | 14,506 |
| 2007 | 13,258 | 10,947 | 12,975 | 12,701 | 14,202 | 12,552 | 13,679 | 14,003 | 12,818 | 14,432 | 13,837 | 13,298 |
| 2008 | 12,545 | 11,379 | 10,879 | 11,656 | 11,457 | 10,007 | 10,290 | 11,726 | 11,375 | 11,932 | 10,867 | 10,553 |
| 2009 | 10,039 | 8,551 | 8,908 | 8,799 | 9,688 | 8,826 | 7,990 | 7,660 | 8,508 | 9,538 | 8,146 | 8,206 |
| 2010 | 7,257 | 6,262 | 6,342 | 6,627 | 6,497 | 6,938 | 7,408 | 7,164 | 6,481 | 5,241 | 5,115 | 5,502 |
| 2011 | 5,084 | 4,730 | 5,175 | 4,980 | 5,714 | 5,639 | 5,515 | 5,759 | 5,949 | 6,194 | 5,934 | 5,447 |
| 2012 | 2,900 | 3,020 | 2,928 | 3,156 | 3,566 | 3,409 | 3,402 | 3,334 | 3,099 | 3,027 | 3,124 | 2,880 |
| 2013 | 3,044 | 2,625 | 3,500 | 2,748 | 2,935 | 2,174 | 2,303 | 2,185 | 1,766 | 1,490 | 1,109 | 1,814 |
| 2014 | 1,975 | 1,948 | 2,034 | 1,374 | 2,211 | 2,516 | 2,364 | 2,428 | 1,702 | 2,098 | 1,884 | 1,871 |
| 2015 | 1,944 | 1,820 | 1,911 | 1,858 | 1,969 | 1,854 | 2,097 | 1,903 | 1,924 | 1,865 | 1,887 | 1,999 |
| 2016 | 1,920 | 1,895 | 2,070 | 1,733 | 1,893 | 1,918 | 1,999 | 1,945 | 1,882 | 1,912 | 1,885 | 2,065 |
| 2017 | 1,887 | 1,816 | 1,955 | 1,713 | 1,824 | 1,840 | 1,497 | 1,979 | 1,963 | 1,925 | 1,919 | 1,895 |
| 2018 | 1,938 | 1,573 | 1,484 | 1,310 | 1,968 | 1,898 | 1,999 | 1,916 | 1,866 | 2,143 | 1,936 | 1,968 |
| 2019 | 1,877 | 1,599 | 1,919 | 1,788 | 1,865 | 1,529 | 2,126 | 2,673 | 2,649 | 2,109 | 1,880 | 1,997 |
| 2020 | 2,064 | 1,817 | 1,782 | 1,440 | 1,574 | 1,661 | 1,717 | 1,728 | 1,837 | 1,715 | 1,566 | 1,704 |
| 2021 | 1,657 | 1,517 | 1,868 | 1,421 | 1,718 | 1,849 | 1,845 | 1,742 | 1,647 | 1,826 | 1,716 | 1,795 |
| 2022 | 1,691 | 1,605 | 1,306 | 1,288 | 1,624 | 1,770 | 1,845 | 1,740 | 1,945 | 2,013 | 1,887 | 1,714 |
| 2023 | 1,799 | 1,825 | 2,068 | 1,799 | 1,769 | 1,725 | 1,863 | 1,803 | 1,717 | 1,955 | 1,944 | 1,797 |
| 2024 | 1,903 | |||||||||||
| - = No Data Reported; -- = Not Applicable; NA = Not Available; W = Withheld to avoid disclosure of individual company data. |
| Release Date: 3/29/2024 |
| Next Release Date: 4/30/2024 |